Economic Affairs, Vol. 65, No. 4, pp. 481-490, December 2020
DOI: 10.46852/0424-2513.4.2020.2
![]()
Research Paper
Role of Exports in Economic Growth: Evidence from India
ABSTRACT
The study attempts to examine the causal relation among export growth, inflation, foreign direct investment and real GDP growth rate for the period 1990–91 to 2018–19 using Vector Auto Regressive (VAR) model and Granger Causality test. Both the statistical techniques employed show similar results pertaining to the causal relationship among the variables selected for the study. The results show that FDI & Real GDP growth have positive effect on export growth and there is no evidence of inflation alone causing export growth, but inflation along with FDI and Real GDP cause the Export growth. There is also evidence that export growth, inflation, real GDP growth together cause FDI. The results also indicate that none of the aforementioned economic variables either individually or jointly cause real GDP growth. The authors opine that slow growth in exports had been compensated by domestic demand and services-led growth in the process of economic growth during the period of study. The study stressed the need for introducing structural reforms to enhance the competitiveness of Indian products in the international markets. The focus should be on designing a new strategy for technology-driven export-oriented sectors as the export stability is positively associated with economic growth.
Highlights
 The paper aims at analyzing the role of exports in economic growth and suggesting the suitable recommendation to the technology driven export-oriented sectors.
Keywords: Exports, Economic Growth, FDI, Inflation, Vector Auto Regressive Model, Granger Causality test
In the era of globalization, the liberalization of investment transactions and the development of financial markets have contributed to international trade. International trade facilitates the nations to procure adequate amount of foreign exchange reserves and optimum utilization of resources. Trade policy reforms introduced in India in 1991 have contributed to significant increase in India's foreign trade during the post-reform period. The total value of foreign trade which was ₹ 75,751 cr in 1990–91, gradually increased to ₹ 3,74,624 cr in 1999–2000 and then rose significantly to ₹ 59,02,401 cr in 2018–19 (Economic Survey 2019–20). India's international business with major trade blocks like European Union (EU), North American Free Trade Agreement (NAFTA), Association of South East Asian Nations (ASEAN), South Asian Association for Regional Cooperation (SAARC), South African Customs Union (SACU) and European Free Trade Association (EFTA) was widened. International trade was emerged as an engine of Economic Growth during the post-reform period.
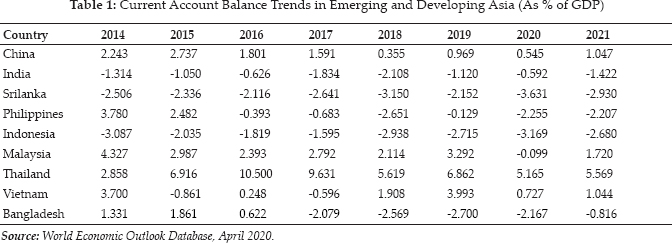
Table 1 presents current account balance trends in emerging and developing Asia as % of GDP. It is clear from the table that the economies like China, Malaysia and Thailand have been experiencing surplus in their current account since 2014. It reflects an excess of exports over imports of goods, services, investment income and unilateral transfers in these economies. In 2019, the surplus in current account of China was registered at 0.969% of its GDP. International Monetary Fund (IMF) in its World Economic Outlook projects current account surplus of about 0.545% of GDP in 2020 and 1.047% of GDP in 2021 for China. This current account surplus in both Philippines & Bangladesh turned into a large current account deficit since 2018. From the above table, it is clear that the current account deficit for Indonesia and Srilanka is at high when compared with rest of the countries in developing Asia. The current account deficit was recorded at 2.1% of GDP in India during 2018 and then declined to 1.1% of GDP in 2019. IMF projects the current account deficit to fall by 0.545% in 2020 and by 1.4% in 2021.
How to cite this article: Tamma Koti Reddy and Lakshmi VDMV (2020). Role of Exports in Economic Growth: Evidence from India. Economic Affairs, 65(4): 481–490.
Source of Support: None; Conflict of Interest: None ![]()
Exports play a major role in accelerating the economic development of developing economies like India. A raising level of exports and a favorable current account can have a positive impact on economic growth of the country. However, heated discussion remains on the causal relationship between the economic variables.
Objectives
The main objective of this study is to examine the role of Exports in Real GDP growth in India for the period 1990–91 to 2018–19. The specific objectives
were:
Literature Review
Zestos and Tao (2002) found a weaker relationship between foreign sector and GDP for USA and Bidirectional causality between foreign sector & GDP in Canada. High inflation and abundance of natural resources are closely associated with low exports and slow growth and a reduction in exports would also reduce real GDP growth (Gylfason, 1997). Hussaini et al. (2015) found bidirectional relationship between GDP and Exports. Mendoza-Cota (2017) reported a positive but weak effects of exports on Mexico's regional economic growth. Fosu (1990) has examined the impact of exports on economic growth of 28 African Low developed economies for the period 1960–1980 using usual augmented production function. The study reveals a positive and significant impact of exports on economic growth.
Thao (2018) has made an attempt to study the relationship between GDP, exports, import, and FDI in Vietnam for the period 1987–2017 using Autoregressive Distributed Lag. The study reveals that there is a long and significant relationship between investment and exports with total domestic output. There was evidence of long-run bi-directional causality between exports and income growth in Libya (Elbeydi et al. 2010) and an inverse relationship between the agricultural exports and economic growth in Nigeria (Verter and Becvarova, 2016). The author opines that the economy should focus more achieving self-sufficiency in agricultural production by reducing its heavy dependence on food imports. The study by Ismail et al. (2009) reveals that exports and investment both have a significant positive impact on economic growth and inflation has a significant negative impact on economic growth in the short-run. In the long-run the results reveals that there is an inverse relations between export growth and economic growth.
Methodology
The study attempts to examine the causal relation between export growth, inflation, foreign direct investment and real GDP growth rate using Vector Auto Regressive (VAR) model. VAR model is applied to examine if the current value of a variable is influenced by the previous period values of the same variable and also previous period values of other variables. Accordingly, VAR model considered in the study is as follows:
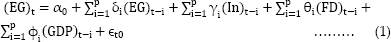
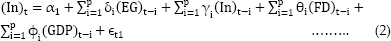
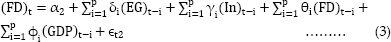
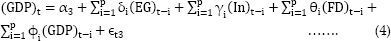
δi', γi', θi'. and φi', are coefficients of lagged values of export growth (EG), Inflation rate (In), Foreign Direct Investment (FD) and Real GDP Growth Rate (GDP) and p is number of lags.
α0, α1, α2, and are intercepts and εt0, εt1, εt2 and εt3 are error terms of the above models.
The study further applies Granger causality test to examine the direction of causal relationship between export growth, inflation, FDI and real GDP growth rate. Analysis has been carried out considering each variable as dependent variable, to examine whether prior period values of other variables have any explanation power on the current value of the given variable.
Composition and Direction of India's Exports
Indian economy has been transformed from a principally primary products exporting country at the time of independence to an export of finished manufactured products in the last four decades. It reflects a considerable change in the composition of trade. The exports of major traditional and non-traditional items have been increased during the reforms period as a result of various initiatives and incentives provided to the exporters by the government. As a result of slow growth in exports compared with imports, the country has been experiencing a huge trade deficit since 1980–81. Direction of India's trade has recorded a remarkable change since 1960. New trade relations were developed with various trade blocks and countries. India has improved its share in the world exports in terms of export of some products. In 2017, Rice alone accounted for 29.4% of share in world exports followed by Spices (18%), Pearls, precious and semiprecious stones (17.9%), Tea and Mate (8.8%) and cereals and cereal preparations (6.4%). There has been a substantial increase in India's Trade-GDP ratio from 11.30% in 1960 to 15.51% in 1990 and further to 49.26% in 2010. In 2018 India's Trade-GDP ratio stood at 43.13%. Export-GDP ratio of the country gradually declined from 15% in 2014–15 to 11% in 2018–19.
Table 2 provides information on the value of foreign trade since 1990–91 in Rupee terms. There has been continuous spurt in the rise of value of imports in India from 1990–91 to 2018–19. The value of imports has grown rapidly from ₹ 43,198 cr in 1990–91 to ₹ 2,15,529 cr in 1999–2000 and ₹ 16,83,467 cr in 2010–11 and finally to ₹ 35,94,675 cr in 2018–19. Eight fold increase in the value of imports has been observed during the post-reform period. The value of imports was highest in 2018–19 and lowest in 1990–91. The value of exports also registered a considerable increase during the post-reform period. The value of exports which was ₹ 32,553 cr in 1990–91 gradually rose to ₹ 1,59,095 cr in 1999–2000, ₹ 11,36,964 cr in 2010–11 and then finally to ₹ 23,07,726 cr in 2018–19. The value of exports has become more than doubled during the tenth five-year plan period. Seven fold increase in the value of imports has been observed for the period 1990–91 to 2018–19. The value of exports was highest in 2018–19 and lowest in 1990–91.
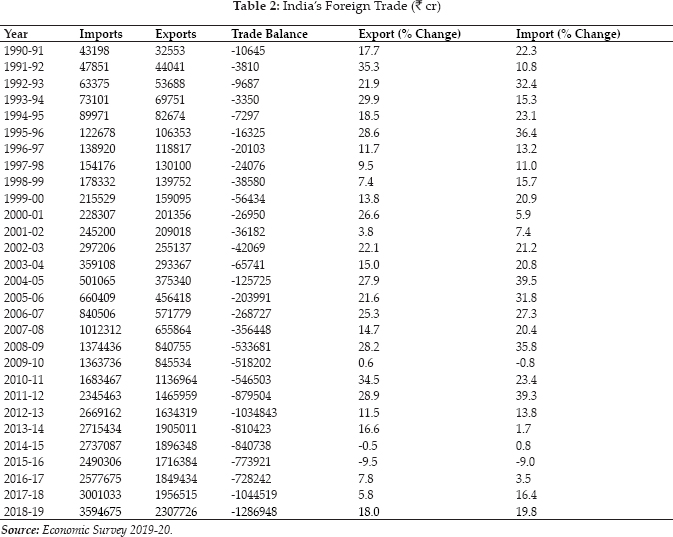
India has been experiencing a significant trade deficit since 1990–91 due to higher value of imports than value of exports. The extent of trade deficit gradually declined from ₹ 10,645 cr in 1990–91 to ₹ 3,810 cr in 1991–92 and then to ₹ 3,350 cr in 199394. Trade deficit reached to a high of ₹ 1,25,725 cr in 2004–05 due to sharp rise in the import value of crude petroleum, gold and other primary products. Trade deficit has grown substantially since 2004–05. In 2005–06 exports increased by 21.6% to ₹ 4,56,418 cr in value. Imports rose by 31.8% to ₹ 6,60,409 cr in value. As a result trade deficit widened to ₹ 2,03,991 cr in 2005–06. Since 2005–06 there has been continuous rise in the value of trade deficit due to heavy dependence on imports. Trade deficit has grown from ₹ 2,68,727 cr in 2006–07 to ₹ 10,34,843 cr in 2012–13 and then finally to ₹ 12,86,948 cr in 2018–19. The value of trade deficit is quite high during the XII five-year plan (2012-17) compared to the previous plans implemented during the reform period.
Table 3 reveals the classification of India's exports into four groups: (1) Agriculture & allied (2) Ores & Minerals (3) Manufactured goods (4) Crude & Petroleum Products and (5) other & unclassified items. It may be observed that the share of agriculture & allied products has been declining in the total export earnings. The share of agriculture & allied in total export earnings considerably reduced from 19.4% in 1990–91 to 9.7% in 2010–11 and then rose to 12.7% in 2017–18 and finally declined to 11.8% in 2018–19. Ores & Minerals have contributed 4.6% of export earnings in 1990–91. Since then its share has continuously declined to 3.4% in 2010–11 and 1.8% in 2018–19. The most important export item in India since 1990–91 was manufactured goods. It accounted for two-thirds of total export earnings. The share of manufactured goods in the total export earnings stood at 70.3% in 2018–19. Share of Crude & Petroleum products increased significantly to 16.8% in 2010–11 and then declined to 12.7 % in 2017–18, again rose to 14.5% in 2018–19. The share of other and unclassified items have shown a gradual rising trends since 1990–91.
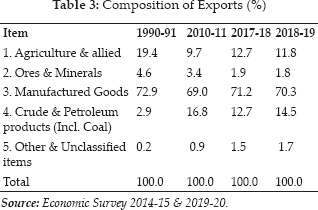
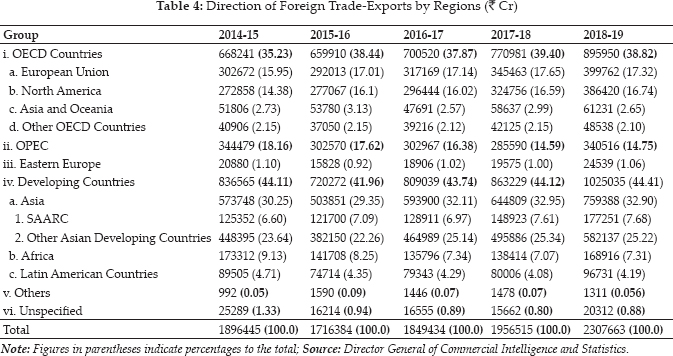
Table 4 provides information on the direction of India’s exports since 2014-15. Block-wise export scenario reveals the share of Developing countries (including Asia & Africa) in India's exports remained highest in recent years. Developing economies accounted for 44.11% of share in India's total exports in 2014–15. Its share declined to 41.96% in 2015–16, but gradually increased from 43.74% in 2016–17 to 44.12% in 2017–18 and then to 44.41% in 2018–19. Among the developing countries, since 2014–15, the share of SAARC and Africa is slightly raising in India's exports. The share of OECD countries in India's exports remains stable in recent years. The share of OECD countries in India's exports increased from 35.23% in 2014–15 to 38.44% in 2015–16 and then marginally declined to 37.87% in 2016–17. Its share in India's exports reached to a level of 39.40% in 2017–18 and then marginally declined to 38.82% in 2018–19. Among the OECD countries, European Union and North America have occupied prominent place in India's exports. The share of EU, North America in India's exports stood at 17.32 % and 16.74% respectively. The share of OPEC marginally decreased from 18.16% in 2014–15 to 17.62% in 2015-16 and finally to 14.75% in 2018–19. The share of Eastern Europe in India's exports remains stable in recent years Eastern Europe accounted for 1 % in India's exports.
Balance of Payments situation in the era of Planning Process
Prior to Independence, India was treated as a source of raw material and market for the manufactured products by the Britishers. India has witnessed a sterling balance of ₹ 1,733 cr in 1946 as the value exports were higher than value of imports. From 1938-39 to 1947–48 the share of raw materials in India's exports declined from 45% to 31% where as the share of manufactured goods has increased from 30% to 49% (Joshi, 2009). After attaining Independence, the planners have not considered the option of Foreign Trade as an engine of economic growth due to their pessimistic attitude towards the potential of export earnings. During the pre-reform period India's share in world exports has declined from 1.91% in 1950 to 0.53% by 1992.
Balance of Payment is a systematic record showing of all economic transactions between one country and the rest of the world. The outcome of the total transactions of an economy with the outside world in one year is known as the Balance of Payment of the economy (Samuelson and Nordhaus 2009). The items in Balance of Payments are broadly classified into (a) Current Account (B) Capital Account (C) Unilateral Payments Accounts (D) Official Settlement Account. All transactions in current account are shown as either debit or credit items. Since Independence, India has witnessed surplus in its current account during 2000–01 to 2002–03 .India has opened up its current account fully convertible since August 1994. Every country will show its capital transactions with the rest of the world in Capital account. Foreign currency inflow and outflow transactions of an economy i.e., Commercial borrowings, NRI Deposits, External bonds issued by the government, FDI, PIS and Security market investment of the QFIs will be shown in Capital account. Large capital inflows in terms of Foreign Direct Investments can be observed in the capital account of Balance of Payments in the recent years. More FDI inflows facilitate to wipe out current account deficit without imposing an excessive burden on the external debt management of the country. Unilateral transfers account in Balance of Payments consists of Government grants, private remittances and Disaster relief etc. Official settlement account in Balance of Payments represents the Official sale and Purchase of foreign currencies and other reserve.
In the era of Planning in India, continuous change in composition and direction of trade, Balance of Payments position of the country has undergone remarkable changes. The structural changes in Indian economy have significantly contributed for the growth of imports like POL, Electrical machinery and electronic goods. The increase in the value of imports has caused for growing deficit in Balance of Payment position of the country. Huge Development activities taken up by the government in the process of economic development, variations in the value of exports of imports due to Business Cycles, Political instability in the economy, change in taste and preference of the people towards foreign goods & services and Rise in domestic aggregate demand can also be considered as some of the factors responsible for growing deficit in the Balance of Payments of the country.
Trends in the Current Account of BoP
The Balance of Payments position of the country during the first five-year plan (1951-56) was satisfactory due to a substantial surplus on the invisible account. As a result the deficit in Balance of Payments was recorded at ₹ 42.3 cr in the entire first five-year plan. In the process of accelerating the economic development the country has adopted heavy industrialization strategy during the second five-year plan.
It was necessitated to depend heavily on the large scale imports of machinery and equipment. Rise in import prices of fertilizers, iron& steel, non-ferrous metals and capital equipment also contributed for growing deficit in Balance of Payments during 195657 to 1975–76. Balance of payments position of the country was within the manageable limit till fourth five-year plan (1969-74).
As a result of increase in exports to middle east economies India has witnessed a small surplus of 0.6% of GDP in its current account during 1976–77 to 1979–80. The tremendous rate of growth of imports where as the slow growth in exports led to severe deficit in the Balance of Payments position of the country during the sixth (1980-85) and seventh five-year plans (1985-90). The deficit in the current account Balance of Payments was registered at ₹ 11,384 cr, ₹ 38,313 cr during the sixth and seventh five-year plans respectively. Rise in international oil prices due to Gulf war in 1990–91 worsened the Balance of Payments position of the cointry. India has maintained a huge deficit in the current account of Balance of Payments to the extent of ₹ 17,369 cr in 1990–91.
There has been a substantial progress in terms of invisible receipts, rise in commercial borrowings, rise in NRI deposits and rise in foreign investment during the reform period. As a result Indian economy has witnessed a sharp reduction in the ratio of current account deficit to GOT. The total deficit in current account of the Balance of Payments has marginally increased from ₹ 62,429 cr in Eighth five-year plan (1992-97) to ₹ 62,716 cr in Ninth five-year plan (1997-2002)There was a surplus in the current account of Balance of Payments from 2001–02 to 2003–04. The surplus has increased from 0.7% of GDP in 2001–02 to 1.2% of GDP in 200203 and further to 2.3% of GDP in 2003–04. In the Post-Independence period, it is the first time that the Indian economy has witnessed a surplus in the current account of Balance of Payments for three consecutive years and it was accompanied by huge net capital inflows (Puri and Misra, 2017).
The deficit in the current account has continued during 2004–05 to 2006–07 due to rise in International oil prices. Since 2007–08 Foreign exchange reserves raised as the net capital inflows far exceeded that of current account deficit. Though, global recession has shown some adverse impact on the growth of exports and imports in 2009–10, foreign exchange reserves raised due to more capital inflows. Huge invisible earning in 2010–11 contributed for reduction in the current account deficit. Since 201314, slow growth in gold imports and favourable terms of trade facilitated to maintain the current account deficit well within the limits of external sustainability. The average annual current account deficit of India has declined from 3.3 % of GDP during 2009–14 to 1.4% of GDP in 2014–19 (Economic Survey 2019–20).
Trends in Exports, Inflation, FDI and Real GDP since 1990–91
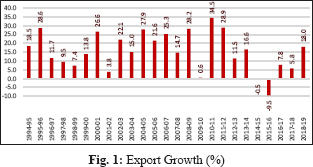
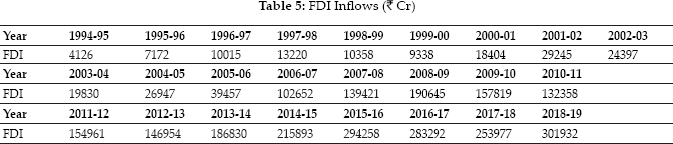
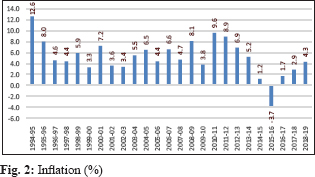
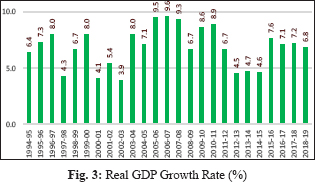
Figs. 1, 2, 3 and Table 5 present trends in the growth of Exports, Inflation (WPI), real GDP and FDI respectively.
Exports
The trend in the growth rate of exports had positive except in two years (2014-15 & 2015–16), but had various fluctuations during the post-reform period. In 1991–92 exports rose gradually to ₹ 44,041 cr showing an increase of 35.3% over 1990–91. The average annual growth of exports during the eighth five-year plan (1992-92) was at 22.17%. The average annual growth of growth of exports during the Ninth (1997-2002), Tenth (2002-07) and Eleventh five-year plan was recorded at 12.3%, 22.38% and 21.38% respectively. The tenth five-year plan was marked by a considerable revival of foreign trade and the value of exports more than doubled in this plan from ₹ 2,55,137 cr in 2002–03 to ₹ 5,71,779 cr in 2006–07. The rate of growth of exports was registered at 25.3% in 2006–07. In 2008–09 the economy has managed to register 28.2% of growth in exports. It is clear from Fig. 1 that India's export growth shown negative during 2014–15 & 2015–16. In 2015–16 exports fell significantly due to reduction in non-oil exports including engineering goods, gems and jewellery and leather in terms of either volume or value. The year 2016–17 witnessed 7.8% of growth in exports, but declined to 5.8% in 2017–18 and then finally increased to 18% in 2018–19. The trend in the growth of exports for the period 19902019 is presented here.
Inflation Rate
India has experienced double digit inflation during the first 3 years of the post-reform period due to huge fiscal deficits and raise in administered prices. The annual average rate of inflation was registered at 13.7% in 1991–92 followed by 10.1% during 1992–93 and then 12.6% in 1994–95. The annual rate of inflation gradually declined since 1995–96 and the same rate further reached to 8.1% in 200809. The annual rate of inflation declined to 3.8% in 2009–10 due to low prices of primary articles and manufactured goods. Again the inflation rate reached the level of 9.6% in 2010–11 and then started declining and reached the level of 1.2% by 2014–15. WPI turned negative (-3.7 %) in 2015–16. In 2016–17 the rate of increase in price level gradually raised to 1.7% and 2.9% in 2017–18 and finally to 4.3% in 2018–19. The trend in inflation rate in India from 1990–2019 is presented here.
Real GDP Growth Rate
The average annual Real GDP growth was registered at low during the Ninth five-year plan (5.7%) and twelfth five-year plan (5.7%) compared to the Eighth (6.56%), Tenth (7.6%) and Eleventh five-year plans (8.04%) implemented during the post-reform period. The trend in Real GDP growth from 1990–2019 is presented here.
FDI Inflows
FDI inflows into India rose from ₹ 174 cr in 1990-91 to ₹ 13,220 cr in 1997–98 and then declined to ₹ 10,358 cr in 1998–99 and ₹ 9,338 cr in 1999–2000. After a recovery, FDI inflows into India accelerated in 2006–07 and the same trend continued in the next decade with fluctuations. FDI inflows increased from ₹ 1,02,652 cr in 2006–07 to ₹ 1,32,358 cr in 2010–11 and then finally to ₹ 3,01,932cr in 2018–19. FDI inflows into Indian economy from 1990–2019 is presented here.
RESULTS AND DISCUSSION
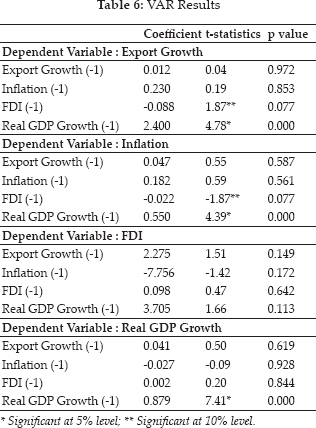
Table 6 exhibits the results of Vector Auto Regressive (VAR) models. When export growth is taken as dependent variable, it is observed that previous year FDI has negative impact on export growth as evident from negative coefficient value of -0.088 (t statistics of 1.87 and p value of 0.077) which is statistically significant at 10% level. Previous year real GDP growth rate has positive impact on export growth, as its coefficient of 2.4 (t statistics of 4.78 and p value of 0.000) is significant at 5% level.
When inflation is considered as dependent variable, negative coefficient of FDI (i.e. -0.022 with p value of 0.077) which is significant at 10% level implies that previous year FDI has negative impact on inflation. Further, it is also observed that previous year real GDP growth rate has positive impact on inflation (coefficient of 0.55 with p value of 0.000).
Considering FDI as dependent variables, there is no evidence of previous year export growth, inflation and real GDP growth rate having impact on FDI. In case of real GDP growth rate as dependent variable, it is observed that only previous year GDP has an impact of on the current year real GDP growth rate (coefficient of 0.879 and p value of 0.000).
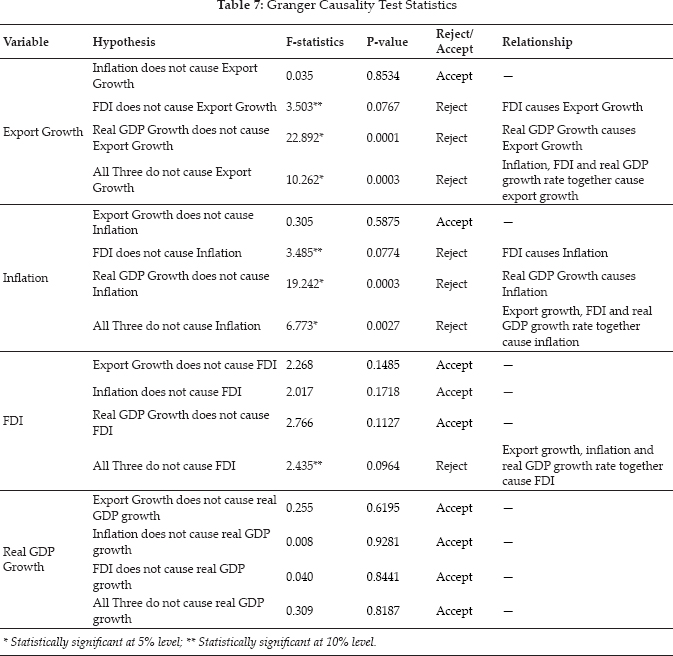
The study applies Granger causality to examine the robustness of the results provided by VAR model and to test the direction of causality, the results are presented in Table 7. Granger causality test also provides evidence in line with VAR test. FDI and real GDP cause export growth. Despite there is no evidence of inflation alone causing export growth, inflation along with FDI and real GDP cause the export growth. FDI and real GDP growth rate cause inflation, where as export growth does not cause inflation. But, export growth with FDI and real GDP growth together cause inflation. There is no factor which alone causes FDI, but export growth, inflation, real GDP growth together cause FDI. Interestingly, there is evidence that no factor either independently or jointly cause real GDP growth rate.
CONCLUSION
From the above discussion it can be concluded that FDI & Real GDP have positive effect on export growth and there is no evidence of inflation alone causing export growth, but inflation along with FDI and Real GDP cause the Export growth. The results indicate that none of the aforementioned economic variables either individually or jointly cause Real GDP growth. The results also reveal that export growth with FDI and real GDP growth together cause inflation.
The growth process since 1991 has been associated with strong domestic demand and services-led growth. The rise in per capita income, per capita consumption and private investment contributed for higher domestic demand in the economy. Productivity gains to the economy through deregulation of industry and finance, Fiscal consolidation, inflation targeting mechanism, improvement in the quality of public expenditure are the factors contributed for higher growth in the economy during the post-reform period. As a result slow growth in exports had not reduced the speed of economic growth.
The government should focus more on introducing structural reforms to enhance the competitiveness of Indian products in the international markets. The focus should be on designing a new strategy for technology-driven export-oriented sectors as export stability is positively associated with economic growth. The export sector in India is experiencing the problems like high cost of credit, inadequate labour skills and innovation, rigid labour markets and high tax component etc. Government should take appropriate measures to address the problems of export sector in order to improve the competitiveness of India's export sector in global markets. There is a need to focus more on exploring the possibilities of having bilateral, multilateral trade agreements with countries/regional blocks by the government.
REFERENCES
Elbeydi, K.R., Hamuda, A.M. and Gazda, V. 2010. The Relationship between Export and Economic Growth in Libya Arab Jamahiriya. Theoretical and Applied Economics, 1(1): 69–76.
Fosu, A.K. 1990. Exports and Economic Growth: the African Case. World Development, 18(6): 831–835.
Gylfason, T. 1997. Exports, Inflation and Growth, A Working Paper of International Monetary Fund, WP/97/119.
Hussaini, S.H., Abdullahi, B.A. and Mahmud, M.A. 2015. Exports, Imports and Economic Growth in India: an Empirical Analysis. In International Symposium on Emerging Trends in Social Science Research, Chennai-India, 3–5
Ismail, A., Zaman, K., Atif, R. M., Jadoon, A. and Seemab, R. 2009. The Role of Exports, Inflation and Investment on Economic Growth in Pakistan. International of Economy, 1(1): 1–9.
Joshi, R.M. 2009. International Business, Oxford University Press.
Mendoza-Cota, J.E. 2017. Exports and Economic Growth in Mexico, 2007–2014: A Panel Cointegration Approach. Semestre Economico, 20(44): 19–44.
Puri, V.K. and Misra, S.K. 2017. Indian Economy, Himalaya Publishing House, 35th Revised edition, pp. 450.
Samuelson and Nordhaus, 2009. Economics, Mcgraw-Hill International Edition.
Thao, D.T. 2018. The Relationships Between, GDP, FDI, Import and Export in Vietnam after 30 years Reforms, IOSR Journal of Economics and Finance, 9(3): 67–73.
Verter, N. and Bečvářová, V. 2016. The Impact of Agricultural Exports on Economic Growth in Nigeria, Acta Universitatis Agriculturae et Silviculturae Mendelianae Brunensis, 64(2): 691–700.
Zestos, G.K. and Tao, X. 2002. Trade and GDP growth: causal relations in the United States and Canada. Southern Economic Journal, 68(4): 859–874.