Economic Affairs, Vol. 65, No. 4, pp. 499-504, December 2020
DOI: 10.46852/0424-2513.4.2020.4
![]()
Research Paper
Dynamics of Area Change in Vegetable Production in Karnataka
ABSTRACT
Area under production of vegetables is increasing over the years despite the gradual fall in total cultivable area in India. Nonetheless, growth in area is not same for all the vegetables. To the assess growth in area and address its disparity, the present study was carried out for the state of Karnataka for the period 199899 to 2017–18. About forty percent increase in area of vegetables has been observed over the period of two decades. Among the vegetables potato, and leafy vegetables recorded negative growth rate. Inequality between districts has also been observed for growth in area under vegetables. Markov chain analysis was employed to obtain transitional probability matrix of area under different vegetables. Projection for area of individual vegetable/vegetable groups for period of eight years has been made by simulating the transition probabilities. Tomato, gourds, cole crops and other vegetables group show positive trend of area over the study period. However, onion and leafy vegetables would have more or less constant area over the projected period. The unbalanced growth within the vegetable group could impact to the economy either by affecting dietary diversity or increasing import dependency for vegetables.
Highlights
 Imbalance in growth of area under production of different vegetables is apparent in the past.
Projected figures for the same depicts, some vegetables occupying more area than others.
Keywords: Vegetables, area, growth rate, Markov chain analysis, probabilities, Projections
In India, horticulture production has outpaced food grain production since 2012–13, with food grain and horticulture production of 281.37 m tonnes and 314.87m tonnes, respectively in 2018–19. Over the last few years, contribution of vegetables remained significant to the whole horticulture production (about 59 to 61 %) (Anonymous, 2018). Birthal et al. (2007) presented evidence of gradual diversification of Indian agriculture towards high-value crops. Further, the major percentage of the farmers growing fruits and vegetables were under the category of smallholders. Agriculture diversification towards fruits and vegetable had consistently increased and rate of increase was higher during post reform period. It was found that crop yield taken proxy for technology was the major source of growth in agriculture at national level for pre-reform period. However for post reform period output price was the major driver for augmented production (Anonymous, 2008). Rao and Joshi (2009) reported that expanding urbanisation together with higher economic growth and changes in the tastes and preferences are causing shift in the food basket in favour of high-value food commodities like fruits, vegetables, milk, meat, egg and fish. This change in the food basket is driving the agricultural production portfolio away from food grains and towards high valued food commodities. This process is likely to continue as the trends in the factors underlying this process have been quite strong in recent past, and are unlikely to subside in the near future.
How to cite this article: Afrin Zainab BI., Umesh K.B., Sreenivas Murthy D., Srikantha Murthy , P.S., Narse Gowda, N.C. and Manjunath, V. (2020). Dynamics of Area Change in Vegetable Production in Karnataka. Economic Affairs, 65(4): 499–504.
Source of Support: None; Conflict of Interest: None ![]()
Vanitha et al. (2013) reported phenomenal increase in vegetable area by about 3 folds, production by 9 folds and productivity by 3 folds in the country for past 6 decades. Un-even growth between the states was observed for vegetable area as well as production. Increase in per capita income, urbanization, health consciousness, complimentary income elasticity for vegetables and diversification of agriculture production towards high value crops were some of the contributing factors for increased vegetable growth in country.
Karnataka being one of the major vegetable growing State contributes about five per cent to the total countries production. As the state is epitome of the diversified agro-climatic zones of India, it has diversity in the range of vegetables grown and disparity between the districts in their production. Some vegetables are occupying more area than others. However, for the better nutritional status and agriculture growth, it is crucial to balance the production of different vegetables. Hence predicting the area change of different vegetables is needed to design the required policies. Hence the study was carried out to understand the pattern of change in area under different vegetables in Karnataka.
MATERIALS AND METHODS
Study area and data source
Study area comprised of all the districts of Karnataka. Major vegetables grown in the state which occupy more than 10% of the vegetable area were considered individually, viz., potato, tomato and onion. Further, major groups of vegetables such as gourds, cole crops and leafy vegetables were taken separately and rest of the vegetables were grouped to form Other vegetables category. Other vegetables group includes brinjal, beans, tapioca, sweet potato, peas, lady's finger, radish, beet root, carrot, capsicum and cluster beans. Thus in effect the analysis had seven vegetables/vegetable groups. This study is based on time series data of area under vegetable production, both district-wise and state total. Required secondary data was collected from Department of Horticulture, Bangalore for period between 1998–99 and 2017–18.
Analytical tools
(a) Compound growth rate
Compound growth rates of area were estimated to study the growth in area of vegetables/vegetable groups. Growth rates of vegetables area were obtained from exponential function as follows:
Y = abte
log y = log a + t log b
CGR (%) = (Antilog b - 1) *100
where, CGR = Compound growth rate; t = Time period in year; y =Area/ production / productivity; a & b =Regression parameters
The ‘t’ test will be applied to test of significance of ‘b’.
(b) Markov Chain Technique
Markov chain analysis was used to project the change in area under different vegetables in Karnataka. Markov chain approach is based on less stringent assumptions and provides more information than the regression approach (Matis, 1985).
When structural changes within the agricultural system are resulted from large number of individually small forces, the system can be treated as a stochastic process in which there are a finite number of possible states (Buckwell, et al. 1983). If the probability distribution of assigning agriculture land to one of the vegetables in any period depends on distribution in the previous period and the dependencies are constant for all period, the process of structural change could be represented by a stationary first order Markov chain.
It should be noted that this techniques assumes the Markov property to forecast the area distribution. Since the predictions are not constrained by any a prior specification of distribution, this procedure is non-parametric (Matis, 1985).
In addition, the transition probabilities have been estimated with assumption of constancy, i.e., all the forces which influenced agricultural structural change in the past will continue to do so in the future (Gaffney, 1992).
A stochastic matrix with the probability, A., of movement of area under vegetable i in period t to vegetable j in period t + 1 is called transition probability matrix (TPM).
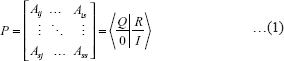
Where, Aij ≤ 0 and ∑jAij = 1
Here P is a square matrix (n × n), with n being the total number of states which are total number of vegetable categories. Each element (Aij) represents the probability of moving from state i to state j.
P could be partitioned into Q matrix, transfer probability matrix among the intermediate state, R matrix, transfer probability matrix from intermediate state to final state,an identity matrix, I, and a null matrix, O.
Consider a matrix M, also called as a fundamental matrix, defined as:

Let F denotes the final probability matrix for each state through finite Markov chain theory (Kemeny and Snell, 1976).
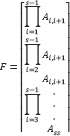
Finally, this matrix may be reduced as below:
The F matrix can be used to project the area under each vegetable/vegetable group.
Since, the single value projections are less realistic and does not reveal the uncertainty of projections, complete distribution of projected value is more appropriate. Hence simulation was utilized to capture the complete distribution of projected values. Projection for area of individual vegetable/ vegetable groups for a period of eight years has been made by simulating the transition probabilities.
Area under the production of different vegetable in the previous period was taken as a start vector for simulating area in the successive years and ran One thousand simulations to incorporate the probabilistic distribution.
Transition probability matrix was build using Solver IDE and probabilities were simulated in Modelrisk 6.1.22 (Vose Software NV, Belgium) to project the area under vegetables. Mapping of district wise vegetable area for different periods was done using Tableau Public 2020.
RESULTS AND DISCUSSION
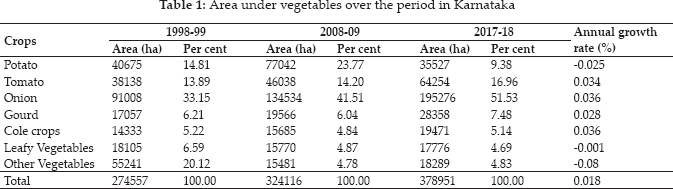
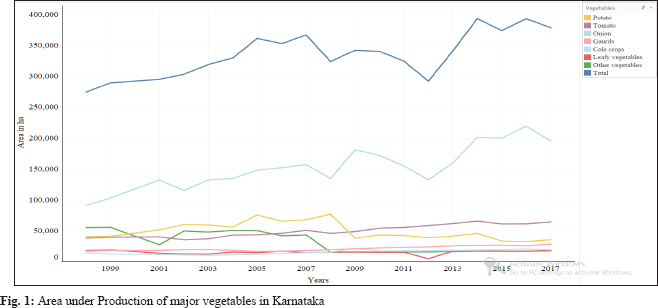
Area under production of vegetables for periods between 1998–99 to 2017–18 is depicted in Table 1.
Vegetable area has reported spike of about 40 per cent in the span of two decades, from 2.7 lakh ha to 3.7 lakh ha. However, the growth is not positive for all the vegetables, viz., potato, leafy vegetables, and other vegetables have recorded negative growth rate. Among vegetables onion had highest area under production followed by tomato and potato (Fig. 1).
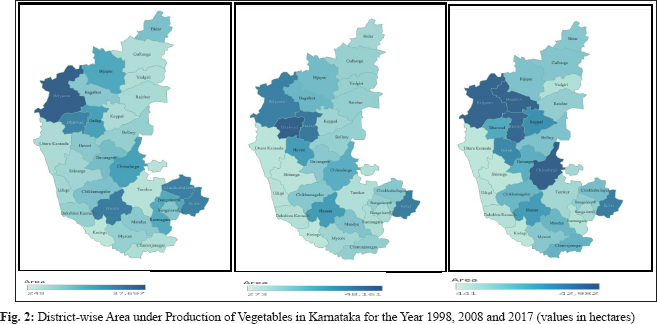
Fig. 2 represents the disparity among the district in allocation of agriculture land for vegetables. Districts such as Belgaum, Bagalkot, Dharwad and Gadag had more area under vegetable production compared to other districts in Northern parts of Karnataka. In Southern parts of the state, Chitradurga, Kolar, Chikkaballapur and Hassan were the major districts for vegetable production. Some districts such as, Hassan, Dharwad and Haveri had reported decrease in share of vegetable area in the state over time.
Table 2 provides a broader indication of changes in area under cultivation of different vegetables in Karnataka over a period of two decades. The Annual TPM describes the probability of movement vegetables/vegetable group from one state to the other (vegetables/vegetable group) during the study period. The off diagonal element Aij (i≠j), indicates the probability of the ith state moving to the jth state. While, the diagonal element Ai],( i=j ), indicates the probability of retaining in the current state. It is evident from the TPM, that Other vegetable group was the most stable category in vegetables, since it has retained almost 87 percent of its area and Leafy vegetables were the least stable, retaining none of its area of cultivation (0.00%).
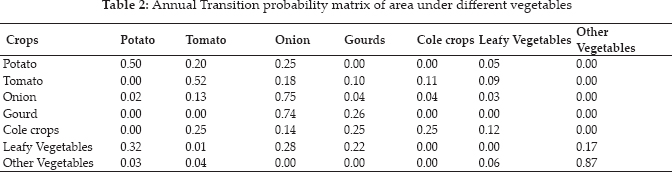
Vegetables such as onion, tomato and potato have probability to retain major share (75 %, 52% and 50% respectively) of previous year area for their production compared to gourd and cole crops (26 % and 25 %). Onion followed by tomato had high probability to gain areas from other vegetables, which is also evident from the greater increase in area compared to the rest.
Applying the transition probabilities to the start vector of area under production of different vegetables, area for the same was projected for period of eight years starting from 2018–19.
Assuming, total area under production constant in future, simulated area for each of the vegetable/ vegetable groups is represented in series of graphs under the heading of Fig. 3. Results revealed that tomato, gourds, cole crops and other vegetables group show positive trend in projection of area over a period. Onion and leafy vegetables would have more or less consistency in the area. However, Potato area showed a sharp decline for the projected period from about 36,000 ha to 18,000 ha. Area under tomato production could drastically increase to 74,000 ha from 64,000 ha. Changing area for different vegetable could be attributed to the prices of those particular vegetables as reported by Rao and Joshi (2009).
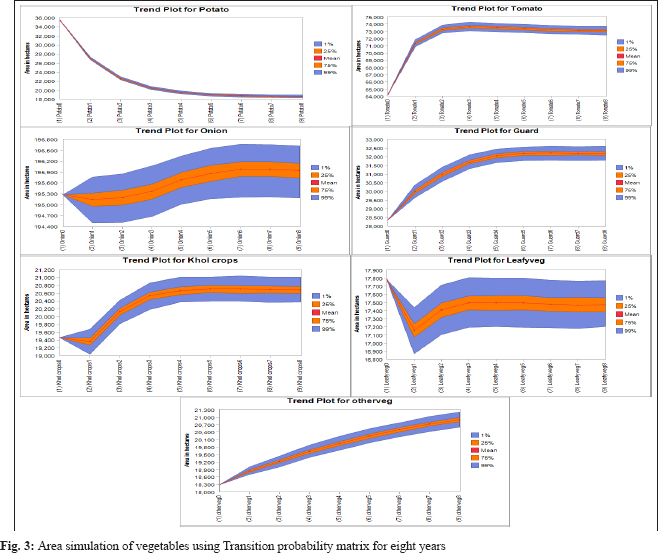
Some vegetables showed wide range for the projected values, viz., onion and leafy vegetables, indicating uncertainty associated in their projections, which could be due to inconsistency of time series data for those particular crops. Also range of projections for potato and tomato was too narrow, might be due to clear trend in data, thus making the projected values more reliable.
CONCLUSION
Akin to other high value crops, area under production of vegetables is also increasing over time. Nevertheless, there exists inequality in growth rates within the vegetable group. Hence the objective of this study is to understand the pattern of area allocation for vegetable and project area under different vegetables in future. Time series data of area for all vegetable crops, district-wise and state total was used for the analysis. Markov chain approach produces the forecast of the target variable, i.e., area under production of different vegetables, using historical data with assumption of Markov property. To sum up, area under all the vegetables projected to have exhibited increasing or constant trend except for potato and leafy vegetables. Potato would decline drastically to 18,000 hectares in eight years. Increase in area of one vegetable than the others indicates the unbalanced growth within the vegetable group. This imbalance in area change could be detrimental to the nutritional security which dampens the diversity in food consumption and increase import dependency of vegetables. To avoid imbalance in vegetable area and production, the government should intervene for the uniform production of all vegetables to achieve the nutritional security and also to avoid the adverse effect of it to the economy.
REFERENCES
Anonymous. 2008. Agricultural Economics, Marketing and Statistics, DARE/ICAR Annual Report 2007–2008, pp. 103–107.
Anonymous. 2018. Horticultural Statistics at a Glance. Ministry of Agriculture & Farmers’ Welfare Government of India, pp. 4–5.
Birthal, P.S., Joshi, P.K., Roy, D. and Thorat, M. 2007. Diversification in Indian Agriculture towards High-Value Crops The Role of Smallholders. IFPRI Discussion Paper 00727.
Buckwell, A.E., Shucksmith, D.M. and Young, D.A. 1983. Structural Projections of the Scottish Dairy Industry Using Micro and Macro Markov Transition Matrices. Journal of Agricultural Economics, 34(1): 57–69.
Kemeny, J.G. and Snell, J.L. 1976. Finite Markov Chains. Springer Verlag, New York, pp. 30–36.
Matis, J.H., Saito, T. and Grant, W.E. 1985. A Markov Chain Approach to Crop Yield Forecasting. Agricultural Systems, 18: 171–187.
Gaffney, P. 1992. A Projection of Irish Agricultural Structure Using Markov Chain Analysis. Working Paper 97–10, CAPRI, Ireland.
Rao, P.P. and Joshi, P.K. 2009. Does Urbanisation Influence Agricultural Activities? A Case Study of Andhra Pradesh. Indian Journal of Agricultural Economics, 64(3): 401–408.
Vanitha, S.M., Chaurasia, S.N.S., Singh, P.M. and Naik, P.S. 2013. Vegetable Statistics. Technical Bulletin No. 51, IIVR, Varanasi, pp. 250.