Economic Affairs, Vol. 65, No. 4, pp. 511-520, December 2020
DOI: 10.46852/0424-2513.4.2020.6
![]()
Research Paper
Determining the Factors Affecting Investment in Punjab Agriculture
ABSTRACT
Investment is the expenditure incurred for real capital formation. A sample of 150 farmers was taken with 23 (15.3%), 28 (18.7%), 46 (30.7%), 43 (28.67%) and 10 (6.7%) farmers selected from marginal, small, semi-medium, medium and large farm size categories respectively in proportion to the share of respective category in total farmers in Punjab. Income, consumption, funds available post-consumption and investment level of the respondent farmers was worked out to find the factors that affect farm investment. Information related to education level, family type, cropping pattern and credit availability was also collected to see if they affect the level of investment. Income, consumption and funds available post-consumption were higher for larger farm households. The level of investment was higher on large farms but the investment per hectare was highest on marginal farms. The availability of credit was more on larger farms but per cent share of credit in investment decreased as the farm size increased as large farmers were using owned funds extensively. The regression analysis revealed that the size of the operational holdings, saving and the credit availability showed positive relation with the level of investment while the education level, family type and cropping intensity were non-significant.
Highlights
 Wheat (39.16% of GCA) is the main crop of the region with highest area under cultivation followed by paddy (21.37% of GCA) and Cotton (9.47% of GCA).
Income as well as consumption expenditure increases as we move from marginal toward large farm-size category farmers.
Overall, investment, income and consumption expenditure is very high on large farms.
Investment per farm shows steep rise as we move from marginal toward large farmers; investment per hectare moves in opposite direction i.e. it decreases with increase in farm size.
Share of investment in livestock is higher for marginal and small farmers; it decreased with increase in farm size. Share of investment in farm buildings in total investment decreases with increase in farm size.
Share of investment in machinery and implements and irrigation structures increases with increase in farm-size.
Factors affecting farm investment includes size of the farm; credit availability, availability of funds after meeting consumption requirements.
Formal or informal grouping of farmers is suggested to marginal and small farmers.
Keywords: Investment, Agriculture, Factors affecting investment and Punjab
Investment is the expenditure incurred for real capital formation. The famous economist J.M. Keynes defined the investment as the increment of capital equipments. Therefore, investment in agriculture may be defined as the increase in the current stock of inputs, buying new machinery, construction of new buildings, poly-houses, etc. and investment in other allied activities like pisciculture, poultry, horticulture, apiculture, sericulture, etc.
How to cite this article: Saini, R. and Kumar, R. (2020). Determining the Factors Affecting Investment in Punjab Agriculture. Economic Affairs, 65(4): 511–520.
Source of Support: None; Conflict of Interest: None ![]()
It is well known that agriculture is backbone of Indian economy and it will remain so in the coming years. The share of agriculture and allied activities in GVA was 17.7 per cent in 2015–16 and it supported 58.00 per cent population of country (Anonymous, 2018). Agriculture was practiced as subsistence farming for past centuries but it has changed into business entity in recent times. Farming as a business enterprise requires constant inflow of investment. Investment in agriculture, generally, may be made by public sector or private individuals. Both investments play important role in development of agriculture but in the regions where conditions for farming are infavourable, initially, public investment is prerequisite for private investment. Evidences from the past have proven that investment in agriculture leads to increase in production and productivity of farms which was termed as green and white revolution in India.
Punjab is the central point of agricultural progress of country. It is one of the leading states in agriculture production and productivity (Anonymous, 2018). The region has one of the most fertile lands in the country which are formed by the delta of rivers running through it. In mid-sixties, investment was focused on new high yielding varieties, insect and pest management practices, water and soil management practices, installing irrigation infrastructures and buying of farm machinery. In the first decade of 21st century, the declining groundwater has forced the state farmers to replace the centrifugal pump sets with high power submersible pumps for groundwater extraction, which accounted for heavy farm investments. On the other hand, due to stagnation in farm productivity, particularly in wheat and rice, income of the farmers did not increased substantially. To overcome the problem, Government is promoting diversification as well as adoption of subsidiary occupations which requires new investment in form of machinery and technology.
In agriculture, investment is one of the most important aspects leading to increase in agricultural production and productivity as productivity of land and labour is determined primarily by the technology used in the production process. Along with quantum of investments, the time of investment is of crucial importance. Agricultural machinery plays important role in various farm operations by increases efficiency. Tractors, irrigation pumps, combine harvesters, sprayers are few of them. There are 4.50 lakh tractors, 7980 combines (self-propellled), 2.62 lakh disc harrows, 1.41 lakh seed-cum-fertilizer drills, 5.93 knapsack sprayers, 14.76 lakh tube-wells, 40248 rotavators, 9030 laser land levelers, 8180 potato planters, 2100 maize shellers in Punjab (Anonymous, 2019). Mechanization of agriculture has resulted in increased agricultural production and reduced costs. Also, timely completion and ease of work are few reasons to make investment in farm machinery. But the studies revealed that use of tractor has become irrational in Punjab due to over-investment. Mander (1987) pointed out that investment in tractor was economically justified only on farms of 20 acre and above.
Farm investment in India is special case as India is a diverse country with diverse lands and agro-climatic features. There is increase in marginal and small operational holdings. Different regions within country have different requirements of investment. At some places, investment is made to ensure irrigation water availability while at other places drainage of water is issue. Similarly, properties of soil vary from place to place thus influencing cropping pattern and cropping system which affects the investment. Cash crops, field crops, orchards and other agriculture allied activities require different type of investments. Investments pattern varies according to climate, cropping pattern, labour availability pattern and technological advancements in the region. Khaund (2002) by regression analysis revealed that institutional credit and farm size are major determinants of overall investment. In study of Deininger and Ali (2008) stated that full land ownership affected the farm investment and productivity. Mehra (2010) in regression analysis for developed region revealed that land size, education level and institutional credit positively and significantly affect the investment in agriculture. Hence, various factors which determine and affect the investment level e.g. operational land holding, education level of decision maker, farm income, non-farm income, family type, credit availability, etc. are analyzed in the study.
METHODOLOGY
The data used for the study has been collected from three agro-climatic zones of Punjab. A multistage random sampling technique was used for selection of sample farm households. A sample of 50 farmers was taken from each cluster of village making the ultimate sample of 150 farmers. In different farm size categories, sample of 23, 28, 46, 43 and 10 farmers was taken in marginal, small, semi-medium, medium and large farm size categories respectively on the basis of the probability proportion to size (PPS) of Punjab operational holdings.
The data obtained was enumerated catgorically for analysis. Simple tabular analysis and functional analysis tools were used for the analysis of data to attain the objectives of the study. Simple tabular analysis was applied to study the pattern of farm investment on different farm size categories and to study the source of finance for making farm investments on different farm-size categories.
Multiple regression technique was used to identify various factors that affected the level of investment on the farms.
Y = a Xbii
Various investment functions used in the analysis were:
Y = f(X1, X2, X3, X4, X5, X6)
where
Y = Level of farm investment (₹); X1 = Size of operational holding (Ha); X2= Annual savings of the farmer (₹); X3 = Credit availability X4 = Cropping intensity (%); X5 = Family type i.e. Joint or Nuclear (Dummy); X6 = Education level of the decision maker (Dummy)
Further details of the computation of the variables are as follows:
Level of farm investment on a farm (Y)
It includes:
(i) Investment on tractors and implements such as tractor trailers, disc harrows, cultivators, rotavators, seed drills, threshers, etc.
(ii) Investment on other farm equipments like sprayers, chaff cutters, carts, etc.
(iii) Irrigation structures like electric motors, generators, diesel engines, generators and investment on tube-well installation.
(iv) Farm buildings like cattle sheds, implement sheds, storage sheds and tube-well rooms.
(v) Investment on livestock inventory.
Size of operational holding (Xx)
This variable was measured as the operational farm-size which comprises the sum of owned land and leased in land minus the leased out land,
Total operational = Ownedland + leasedin- leasedout holding land
Funds available post-consumption (X2)
It is the variable obtained after the household expenditure is deducted from the total income of the farmer.
Funds available (post — consumption) = Totalincome - Consumption expenditure (annual) (annual) (annual)
Total income (annual)
It is sum of:
(i) The income received from crops enterprises.
(ii) Income received from the dairy enterprises.
(iii) Income of farm household from non-farm activities like services, business, pension etc.
Total income = Income from + Income from + Non — farm crops dairy incomes
Consumption expenditure (annual)
It includes expenditure on food items, education, clothing, medicine, etc.
Credit availability (X3)
The amount borrowed for farm investment was taken as proxy for the credit availability.
Cropping intensity (X4)

Family type i.e. Joint or Nuclear (X5)
It was taken as dummy variable.
Education level of the decision maker (X6)
It was taken as dummy variable.
RESULTS AND DISCUSSION
Investing in the farm business is affected by many factors. Various factors were taken into consideration after going through the literature. The data was collected and analysed for the factors which were considered most important in the present study. Data for operational holdings, crops grown, education of the farmer, family type, etc was collected and the results are shown below:
Operational holding
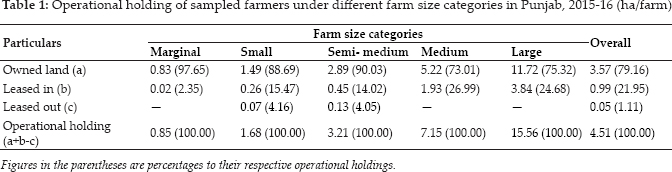
Operational holdings were worked out by summing up owned land and leased-in land and subtracting leased-out land out of it. Average operational holdings in different farm size categories in Punjab are presented in table 1.
On an average, operational holding came out to be 4.51 hectare. The share of owned land (3.57 hectare) was 79.16 per cent and that of leased-in land (0.99 hectare) was 21.95 per cent and the share of leased-out land (0.05 hectares) was 1.11 per cent for total operational holdings. In different farm size categories, operational holding came out to be 0.85, 1.68, 3.21, 7.15 and 15.56 hectare for marginal, small, semi-medium, medium and large farm categories respectively.
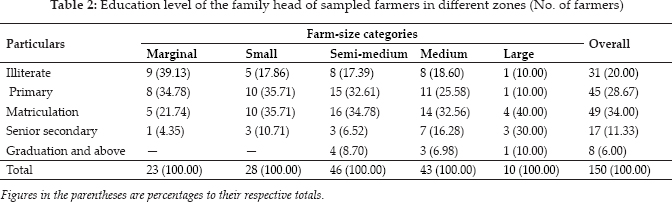
Education level of the family head
Education has been considered as the measurement rod for judging the intellectual of a person. It may not be true in all the cases but it gives us fairly good idea about the generally accepted mental level of the individual. So, to judge whether education level of the decision maker has any effect on the farm investment decision and to know general education level of the farmers in different farm size categories, the education level of the head of the family is presented in Table 2. The perusal of table reveals that 20.00 per cent farmers were illiterate, 28.67 per cent farmers were having primary education, 34.00 per cent farmers were matriculate, 11.33 per cent farmers were senior secondary and 6.00 per cent farmers have pursued graduation or above. It was found that in marginal farm-size category, 39.13 per cent farmers were illiterate, 34.78 per cent farmers have studied primary standard, 21.74 per cent farmers were matriculate and 4.35 per cent farmers were senior secondary. In small farm size category 17.86, 35.71, 35.71 and 10.71 per cent farmers were illiterate, primary, matriculate and senior secondary respectively. There were no respondents with graduation or above education in small and marginal farm size category. It may be due to lack of financial resources or due to ignorant behavior toward education. In semi-medium farm size category, 17.39, 32.61, 34.78, 6.52 and 8.70 per cent farmers were illiterate, primary, matriculate, senior secondary and graduate and above respectively. In medium category, 18.60, 25.58, 32.56, 16.28 and 6.98 per cent farmers were illiterate, primary, matriculate, senior secondary and graduate and above respectively. Similarly, in large farm size category, 10.00, 10.00, 40.00, 30.00 and 10.00 per cent farmers were illiterate, primary, sixth, senior secondary and graduation and above respectively.
Cropping pattern
The data pertaining to the cropping pattern of the farmers has been presented in Table 3.
Cropping pattern prevailing in the region influences the investment. Different crops have different agronomic practices. Seed bed preparation in case of wheat is different from transplanting of seedling in rice. Similarly, sugarcane and cotton requires fine seed bed while maize and potato are best grown in furrows. Similarly, method of sowing is different for different crops ranging from seed depth, row to row and plant to plant distance. Labour and irrigation requirements are different for different crops. Also, there are some crops which require use of weedicides and other requires hoeing to control weed menace. The intensity of insect pest attack and disease to the crop also varies for different crops. At the end, when crop is ripened, different crops are harvested by different methods. Cereals may be harvested by combines whereas potato requires diggers and cotton crop is harvested manually. There are crops which require post-harvest operations like maize, oilseeds and pulses, etc. All these agronomic operations require different type of technology and machinery thus influencing investment.
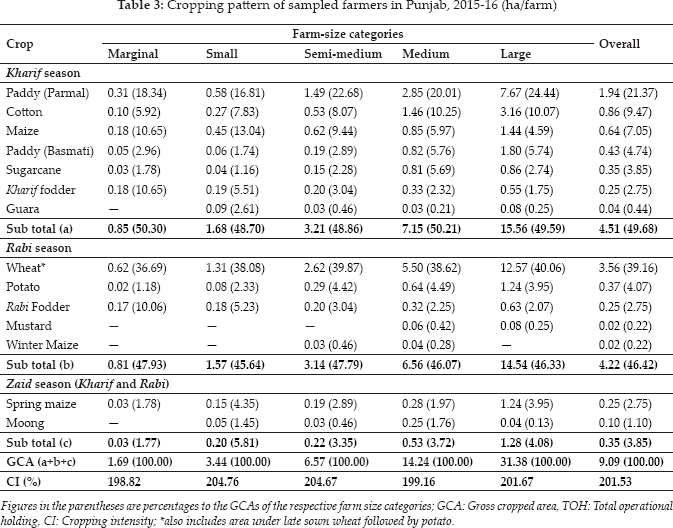
In kharif season, the crops grown were paddy, cotton, maize, basmati, sugarcane, kharif fodder and guara. In rabi season, the crops grown by respondent farmers were wheat, potato, fodder, mustard and winter maize. In zaid kharif and zaid rabi seasons, spring maize and moong crops were reported on the sampled farms. Cropping intensity of sampled farms was worked out to be 201.53 per cent. Gross cropped area (GCA) came out to be 9.09 hectare out of which 49.68 per cent was sown in kharif season, 46.42 per cent was sown in rabi season and 3.85 per cent in zaid kharif and zaid rabi season. In kharif season, paddy (parmal) was the major crop on the sample farms which was cultivated on 21.37 per cent of the GCA followed by cotton (9.47%), maize (7.05%), paddy (basmati) (4.74%), sugarcane (3.85%), kharif fodder (2.75%) and guara (0.44%). In rabi season, wheat was the major crop with 39.16 per cent of GCA under wheat followed by potato (4.07%), rabi fodder (2.75%), mustard (0.22%) and winter maize (0.22%). In zaid kharif and zaid rabi season, 2.75% and 1.10% was sown under spring maize and moong crops respectively. Cropping intensity was calculated to be around 200 per cent for all farm size categories.
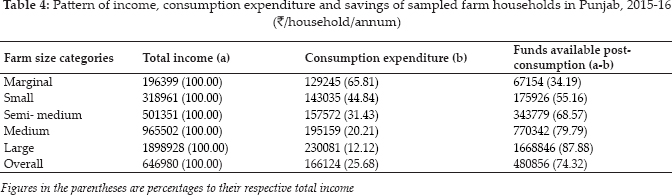
Pattern of income, household expenditure and savings
An attempt has been made to understand the pattern of income, household expenditure and thus, to unfold savings of the sampled farms. The findings have been shown in Table 4. Difference of total income and consumption expenditure was used to work-out savings. On an average, total income was ₹ 646980 per farm and total expenditure was ₹ 166124 per farm. In overall scenario, on an average 74.32 per cent of the income was left with the farmer after meeting the consumption expenditure. It was observed that savings were least on marginal farms i.e. 34.19 per cent, followed by small (55.16%), semi-medium (68.57%), medium (79.79%) and large (87.88%) farms. Income as well as expenditure increased with increase in farm size and the savings also showed the same trend and increased with increase in farm size.
Investment
It is apparent that different farm size categories have different tendency to invest. Agricultural investment can be made in large number of items like agricultural machinery, implements, irrigation structures, farm buildings and livestock inventory, etc. The type and size of the implements and other assets may vary according to the needs of the individual farmers. Monetary value of the investment made by farmers can be analyzed on investment per farm basis to analyze the difference in different farm size categories. Similarly, investment per hectare may give us more details on the investment rational of the farmers in different farm size categories. The farmers work upon the farm unit i.e. set of resources under single entrepreneurship but the investment can be best studied keeping a standard unit of land under consideration so that all the farm investments can be analyzed on the same unit of measurement. Farmer's investment has been analyzed for different farm size categories and the results are presented below:
Investment pattern in different farm assets per farm unit
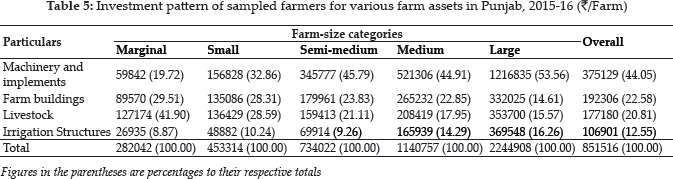
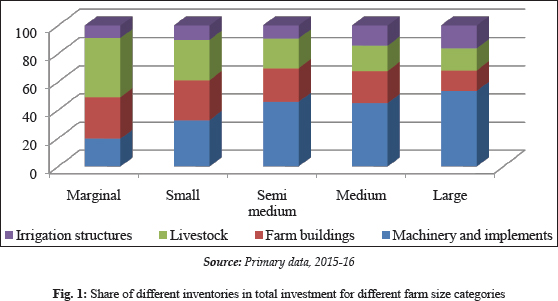
The table 5 shows the investment made by farmer on a farm. Overall investment for all farm assets per farm came out to be ₹ 851516. In various farm assets, the share of investment per farm on machinery and implements was highest (44.05%) followed by farm buildings with share of (22.58%), livestock (20.81%) and irrigation structures (12.55%). On marginal farms, total investment per farm was ₹ 282042 in which livestock had maximum share (41.90%), followed by farm buildings (29.51%), machinery and implements (19.72%) and irrigation structures had minimum share (8.87%). In small farm size category, investment per farm was ₹ 453314 with 32.86 per cent share of machinery and implements followed by livestock (28.59%), farm buildings (28.31%) and minimum share was of irrigation structures (10.24%). On semi-medium farms, investment per farm was ₹ 734022 in which share of machinery was highest i.e. 45.79 per cent, followed by farm buildings (23.83%), livestock (21.11%) and irrigation structures (9.26%). In medium farm size category, investment per farm was ₹ 1140757 and similar trend was observed as that of semi-medium category with highest share of machinery and implements (44.91%), followed by farm buildings (22.85%), livestock (17.95%) and irrigation structures (14.29%). On large farms, investment per farm was ₹ 2244908 in which share of machinery and implements was 53.56 per cent followed by irrigation structures (16.26%), livestock (15.57%) and least share of farm buildings (14.61%). To put more clarity on the trends one can see Fig. 1 which clearly shows that share machinery and implements, irrigation structures in the total investment increased as we move from lower farm size category to higher farm size category. We know that machinery is a necessary requirement of all farmers but its negligible presence on marginal and small farms is a problem. Government should promote co-operative agro service centers to help these farmers so that they can have efficient use of their land resources. On the other hand, share of farm buildings and livestock in the total investment kept decreasing as we moved from marginal from size category toward large farm size category but it kept increasing in absolute terms.
Figures in the parentheses are percentages to their respective total income
Investment pattern of farmers on various farm assets per hectare
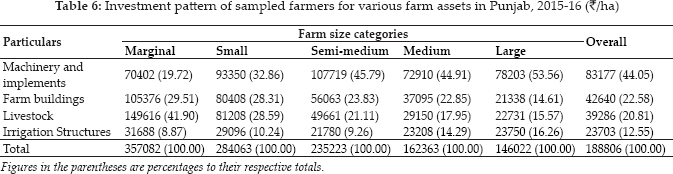
The investment pattern per hectare for various farm assets in Punjab can be analyzed from the Table 6. Overall investment for farm assets per hectare came to be ₹ 188806. In the analysis of different farm size categories, total per hectare investment on marginal farms was ₹ 357082 which decreases as the farm size increases and investment was ₹ 284063, ₹ 235223, ₹ 162363 and ₹ 146022 on small, semi-medium, medium and large farms respectively. While inspecting individual farm assets categories in the different farm category analysis, it was found that in case of farm machinery and implements, overall investment was ₹ 83177. Highest investment was ₹ 107719 on semi medium farms followed by small farms 93359), large farms 78203), medium farms 72910) and least for marginal farms 70402). In farm buildings, overall investment was ₹ 42640 and in different farm size categories maximum investment per hectare was on marginal farms i.e. ₹ 105376. It keeps on decreasing as the farm size increases and it is least on large farms 21338). Investment on livestock inventory per hectare showed similar trend as farm buildings. It was highest on marginal farms 149616) and least on large farms 22731). Overall investment on livestock was ₹ 39286 per hectare. Average investment per hectare on irrigation structures was ₹ 23703. In different farm size categories, investment per hectare on irrigation structures was highest on marginal farms 31688), followed by small farms 29096), large farms 23750), medium farms 23208) and least on semi-medium farms 21780).
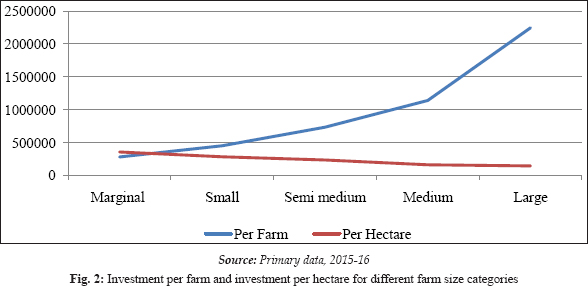
The investment per farm increased with the increase in farm size while analysis of investment per hectare showed declining trends of investment with increase in farm size which is clearly visible in Fig. 2. It can be concluded that fixed costs per hectare decreases with increase the farm size which may make strong case for collective farming for farmers having smaller land holding to get same benefits as enjoyed by the large farmers.
Role of credit in farm investment
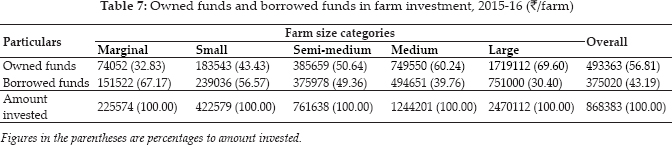
Investment can be made by two basic sources i.e. owned funds and borrowed funds. Owned funds of the farmers may vary depending upon lot of factors like farm income, non-farm income, expenditure behavior, etc. On the other hand, borrowed funds are arranged by the entrepreneur from time to time to meet his business requirements when he lack owned funds to meet the same. One may borrow funds to expand business. There are two basic sources of credit: institutional and non-institutional. They play important role in shaping-up the investment pattern of the individuals. The share of owned funds and borrowed funds in farm investments in Punjab has been presented in Table 7. On an average, amount invested was ₹ 868383 per farm in which owned funds hold 56.81 per cent share and borrowed funds has share of 43.19 per cent. In case of marginal farms, borrowed had the maximum share (67.17%) in the total investment and that of large farm size was minimum (30.40%). On the contrary, owned funds were extensively used by large farmers with 69.60 per cent share in amount invested by them and use of owned funds was least on marginal farms with merely 32.83 per cent share in total amount invested. These trends were analyzed and it was concluded that it was observed due to higher availability of capital with large farmers. They have more income thus more savings which enable them to use owned funds for farm investment.
Factors Affecting Farm Investment
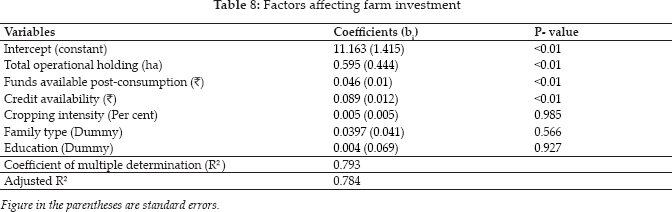
There are number of factors which may affect the farm investment. It may vary from individual to individual as each individual is unique with different economic conditions, resources available and approach to agriculture. The regression analysis technique is used to identify the factors which affected the farm investment. Various approaches were carried out to find the best fit to the equation. Linear and non-linear forms of regression equation were used to check the best fit and results of nonlinear model were retained. The Table 8 presented the results of the regression analysis for different variables which affected farm investment on Punjab farms..
Cobb-Douglas production function was used to see the affect of different variables on the investment. Coefficients represented the investment elasticity of the variables i.e. change in investment with change in variables. It was observed that overall regression equation was significant. Six relevant variables i.e. total operational holding (ha), funds available post-consumption (₹), credit availability cropping intensity (percentage), family type (dummy) and education (dummy) were taken but only operational holdings, savings and credit availability were significant. Cropping intensity, family type and education were non-significant. Coefficient of multiple determination came out to be 0.79. It can be observed that with one per cent increase in the operational holdings the change in investment would be 59.5 percent, increase in saving by one percent would increase investment by 4.6 per cent and one per cent increase in credit availability will lead to increase in investment by 8.9 per cent. If the percent increase is more the change in investment decreases. Suppose, the per cent increase for operational holdings, funds available post-consumption and credit availability is 10 per cent, the per cent increase in investment with respect to operational holdings, savings and credit availability will be 5.95, 0.46 and 0.89 per cent respectively. This phenomenon was observed due to the fact that as we keep on increasing operational holdings need of investment per hectare keep on decreasing as found in the Fig. 2.
CONCLUSION
It was seen that total farm investment per farm increases with increase in farm size, however, it decreases with increase in farm size on per hectare basis. The major share in the investment on all the farm size categories except marginal ones was on machinery and implements. However, on marginal farms, livestock was the major contributor of total investment. Regression analysis revealed that total operational holdings, funds available post-consumption with a household, and credit availability were having significantly positive relationship with the farm investment on the sampled farms. The investment credit taken by the respondent farmers per farm declined with increase in the farm-size in relative terms. Also, in total amount borrowed, the share of institutional credit agencies increased with increase in farm size and share of non-institutional credit agencies decreased with increase in farm size.
Policy implications
The Government may setup more Co-operative Agro service centre in the village so that small farmers can avail custom hiring services instead of making investment in machinery.
The marginal and small farmers may form informal groups for group farming to reduce their fixed costs.
REFERENCES
Anonymous. 2018. Agricultural Statistics at a Glance. Government of India, Ministry of Agriculture, Department of Agriculture and Cooperation, Directorate of Economics and Statistics, New Delhi.
Anonymous. 2018. Statistical Abstract of Punjab, Economic advisor to Government, Economic and statistical organization, Government of Punjab, Chandigarh.
Anonymous. 2019. Statistics of Punjab Agriculture. Punjab Agricultural University, Ludhiana.
Mander, G.S. 1987. An economic analysis of investment pattern on Punjab farms. Ph.D. dissertation, Punjab Agricultural University, Ludhiana, India.
Khaund, S. 2002. Agricultural investment and the role of financial institutions: A study of Assam with special reference to the central Brahmaputra valley zone. Ph.D. dissertation, Gauhati University, Guwahati, India.
Deininger, K. and Ali, D.A. 2008. Do overlapping land rights reduce agricultural investment? Evidence from Uganda. Amer. J. Agri. Econ., 90: 869–82.
Mehra, S. 2010. Pattern of Farm investment among cultivating households: A comparative study of Haryana and Orissa. Ph.D. dissertation, Jawaharlal Nehru University, New Delhi, India.