Economic Affairs, Vol. 65, No. 4, pp. 521-528, December 2020
DOI: 10.46852/0424-2513.4.2020.7
![]()
Research Paper
Reducing Farm Risk though Diversification in Tomato Based Farming Systems of Eastern Dry Zone of Karnataka
ABSTRACT
This study comprise of minimizing farm risk through diversification in tomato based farming systems (TBFS). Primary data was collected from 3 taluks of Kolar District, Karnataka viz., Malur, Mulbagal and Srinivaspura representing cultivation of tomato hybrids, High yielding varieties (HYVs) and both, respectively. The total sample size was 150 tomato growers, 50 from each taluk. Tomato was grown as a major crop in all the 3 taluks. Farmers had diversified to different crops and farm enterprises along with tomato in order to reduce their income risk. Herfindahl diversification index and Crop diversification index was calculated. Based on which, farmers having high and medium degree of diversification faced lower income risk as compared to those farmers having lower degree of diversification. In all the three taluks, the inclusion of livestock as a component under any TBFS lowered the income risk faced by the farmers. The results of quantile regression analysis showed that, the variable CDI (Crop Diversification Index) was significant across all quantiles showing that as the degree of farm diversification increased, the variability in total annual income of the farmers decreased as risk was reduced when the income was diversified from different sources or enterprises.
Highlights
 Farmers having high and medium degree of diversification faced lower income risk as compared to those farmers having lower degree of diversification.
Keywords: Diversification, quantile regression, tomato based farming system, farm risk
As Agriculture is a gamble with nature, risk and uncertainty become part and parcel of agriculture. Agricultural production is susceptible to a number of risks such as climatic change, price volatility, pests and disease infestation to mention a few (Adeoye et al. 2012). Agriculture is subjected to risks due to the variable economic and biophysical environment in which farming operates. Risk is an imperfect knowledge situation where the probabilities of the possible outcomes are known. Agriculture risks arise due to uncertainty over factors determining returns to agricultural production (Kiran, 2013).
Tomato crop is being cultivated since long time in Kolar district, Eastern dry zone of Karnataka contributing to a major part of tomato production to the state and the country. The district had highest area (6618 ha) and production (66553 tons) under tomato cultivation in Karnataka during 2003–04. Tomatoes grown here are marketed to Maharashtra, Tamil Nadu, Madhya Pradesh, Andhra Pradesh, Telangana and many other states (Lokesh et al. 2005). Tomato, being a capital and labour intensive crop, requires irrigation water throughout the cropping period and becomes risky to cultivate as compared to other vegetables. Any shortage or excess of rainfall poses risk of yield loss to tomato growers in addition to reduction in the quality of the produce fetching lower prices. In addition to this, it has shorter shelf life making it difficult to store resulting in inelastic supply and volatility in its market prices posing the tomato farmers to market risk. Despite high volatility in prices, large numbers of farmers were cultivating tomato especially in this district. To minimize their risk in cultivating only tomato, they had diversified to cultivate other crops along with tomato and also took up other allied activities as sericulture, livestock etc. Maharjan (2002) says, diversification of enterprises helped in reducing the income risks in farming. It was the most popular on-farm strategy used by the farmers.
How to cite this article: Vanitha, S.M. and Chinnappa Reddy, B.V. (2020). Reducing Farm Risk though Diversification in Tomato Based Farming Systems of Eastern Dry Zone of Karnataka. Economic Affairs,
65(4): 521–528.
Source of Support: None; Conflict of Interest: None ![]()
Tomato based farming system is a type of farming system in which farmers along with tomato as their base crop had diversified to the production of other crops and subsidiary occupations such as sericulture, livestock and others. Farmers who were growing tomato for minimum of one year or more and having a major or substantial proportion of farm income derived from tomato cultivation were considered for the study. Such farmers growing tomato in one or two or in all the three seasons along with other crops and allied farm and/or non-farm activities were selected randomly. A study was conducted with an objective to analyze how diversification minimizes farm risk under tomato based farming systems using quantile regression analysis.
MATERIALS AND METHODS
Primary data through personal interview was collected from 3 taluks of Kolar District, Karnataka viz., Malur, Mulbagal and Srinivaspura representing cultivation of tomato hybrids, High yielding varieties (HYVs) and both, respectively. The total sample size was 150 tomato growers, 50 from each taluk. Farmers had diversified to different crops and farm enterprises along with tomato in order to reduce their income risk. They allocated farm land to different farm enterprises and reduced the dependence on tomato. This behavior of farmers was quantified using the Herfindahl index.
The Herfindahl index (also known as Herfindahl-Hirschman Index or HHI) was named after economists Orris C. Herfindahl and Albert O. Hirschman. Herfindahl Index (Pal and Kar, 2012) and was computed by taking sum of squares of acreage proportion of each crop in the total cropped area. Mathematically, the index is expressed as below:

Where, N is the total number of crops, Pi represents area proportion of the ith crop in total cropped area, it is given by dividing the area under ith crop by the total cropped area,

Where Ai is area under a specific crop, EAi is total area under all crops. The value of Herfindahl index lies between 0 and 1. With the increase in diversification, the Herfindahl Index would decrease. This index takes a value of one when there is complete concentration or specialization and approaches zero when diversification is perfect.
The degree of crop diversification was measured in order to know how farmers were minimizing their production or income risk through diversification, the Crop Diversification Index (CDI) used as mentioned below (Sichoongwe et al. 2014).
The zero value indicates specialization and a movement towards one shows an increase in the extent of crop diversification.
To infer about the magnitude of risk associated with the tomato growers, the coefficient of variation (CV) was estimated. The CV was used as a measure to study the variability in area, production, productivity and income from various sources of enterprises under tomato based farming system. It was computed using the following formula,
Quantile regression is used as an alternative to ordinary least squares (OLS) regression and related methods, which typically assumes that association between independent and dependent variables are the same at all levels. It is applied in the present study as the data finds heteroscedasticity and deviates from the assumptions of OLS regression. This may be because of presence of too many outliers in the data. Quantile regression is not a regression estimated on a quantile, or subsample of data. In OLS regression, the goal is to minimize the distances between the values predicted by the regression line and the observed values. In contrast, quantile regression differentially weighs the distances between the values predicted by the regression line and the observed values, and then tries to minimize the weighted distances. In the present study, the objective of examining effect of diversification in minimizing farm risk is studied using quantile regression. The co-efficient of variation of income is considered as a proxy for the income risk faced by the farmers. The variables considered for quantile regression and the method followed for the analysis is as given below:
Let Y be the dependent variable with cumulative distribution function CDF FY (y) = P(Y ≤ y). The Tth quantile of Y is QT(Y) = inf {y: FY (y) ≥ t}, where 0 < τ < 1 is the quantile level.
A linear quantile regression model,

Where the sample estimate β(τ) is the marginal change in the τth quantile due to the marginal change in x. Quantile regression allows us to study the impact of predictors on different quantiles of the response distribution, and thus provides a complete picture of the relationship between Y and X. Quantile regression estimate uses the formula as given by Koenker and Bassett (1978),
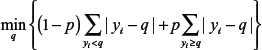
The error function for minimization is transformed into the standard “Linear Programming” type of dual problems for minimization and maximization. Then, linear programming algorithms are applied to solve the parameters for quantile regression. STATA was the software used to run the quantile regression model. Breusch-Pagan / Cook-Weisberg test for heteroscadasticity was applied to check for the presence of heteroscedasticity in the data. The variables considered in the study are:
Y = Dependent variable = CV of annual income of the sample respondents (%)
Xi = Independent variables considered are
X1 = Crop Diversification Index (CDI)
X2 = Income from tomato (₹)
X3 = Income from other crops (₹)
X4 = Non-farm income (₹)
X5 = Income from livestock (₹)
X6 = Income from sericulture (₹)
RESULTS AND DISCUSSION
On an average, highest average area under dry land was 4.87 acres in Malur taluk (Fig. 1) where 22 per cent of the respondents cultivated eucalyptus in dry land. It was 4.19 acres in Srinivaspura taluk where 36 per cent of the sample respondents cultivated mango. In the case of Mulbagal taluk, it was 3.62 acres of dry land where both mango and eucalyptus plantations were cultivated. Sample respondents of all the three taluks had grown rainfed ragi, groundnut and horse gram mainly for home consumption and rainfed maize for fodder purpose in dry land area.
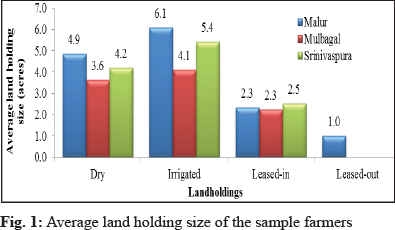
In the aggregate, highest landholding size was observed in Malur taluk at 10.14 acres, which also had the highest average irrigated area of 6.10 acres which represented cultivation of tomato hybrids as the main irrigated crop of the region. In Srinivaspura taluk, the irrigated area was 5.42 acres out of 9.30 acres of total land holding. In this taluk farmers were growing both hybrids and HYVs of tomato under irrigation. Around 4.00 acres of irrigated area was cultivated out of 6.39 acres of total land holding in Mulbagal taluk. This was the lowest among the three taluks which represented HYVs of tomato.
The highest average leased-in land was 2.52 acres in Srinivaspura taluk where the respondent farmers grow both hybrids and HYVs of tomato. It was mainly for mango orchards and along with it farmers cultivated intercrops in the initial period of mango crop. The average leased in land in Malur taluk was 2.33 acres and in Mulbagal taluk, it was 2.25 acres. Leased in land was valued based on the number of crops taken up per year and only land without irrigation was leased in. Water requirement for cultivation of crops was met by the tenants from their own land through pipes. Tomato was the major crop grown in leased-in land.
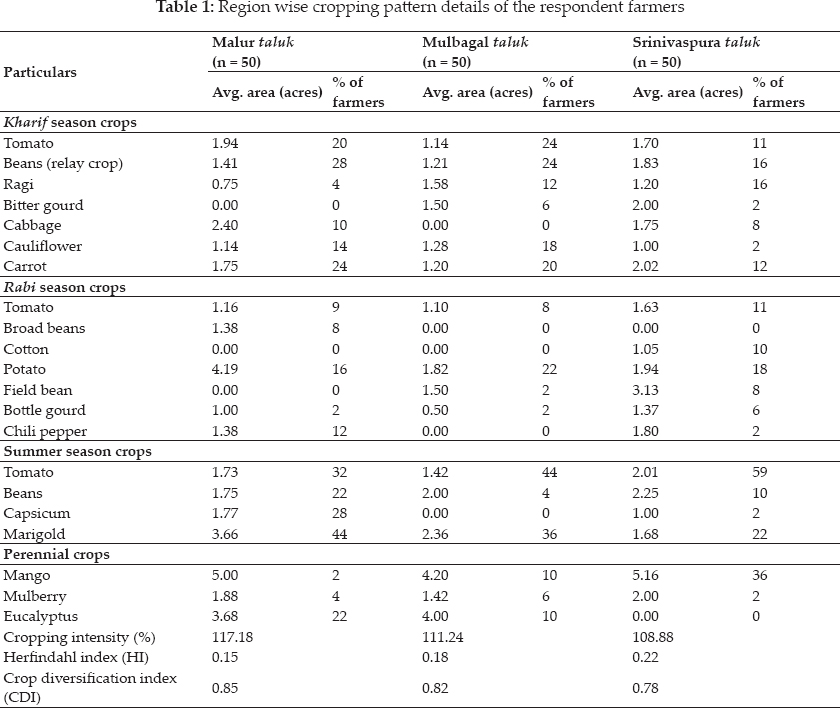
Tomato was grown as a major crop in all the three taluks and also in all the three seasons which might have resulted in higher cropping intensity in the study area. The Crop Diversification Index (CDI) was calculated for each taluk using the Herfindahl index. Crop diversification index was highest in the case of Malur taluk where different types of crops were grown including mango, eucalyptus, capsicum and others. It was followed by Mulbagal and Srinivaspura taluks. Lowest crop diversification index was in Srinivaspura taluk because mango was the major crop (Table 1).
Based on the CDI, the sample farmers from all the three taluks were classified into three types of diversification. Majority of the sample farmers had medium and high level of diversification and very few were with low degree of diversification in all the three taluks of the study area. This showed that the farmers were aware of the benefits of diversification and were already reaping the benefits out of it. It also helped them to minimize the risk faced from specializing in a single farm enterprise.
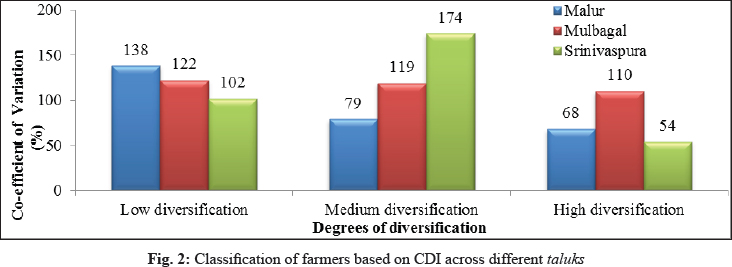
The average annual income of the farmers was higher for those having higher and medium degree of diversification compared to those farmers with lower degree of diversification. This was because farmers having higher diversification earned income from more number of enterprises than those having less diversification. Farmers having high and medium degree of diversification faced lower risk as compared to those farmers having lower degree of diversification as shown by the figures of CV in Fig. 2. This implied that as the magnitude of diversification increased the risk faced by the farmer decreased, so that he had ensured earnings from one or the other source, if other enterprises incurred loss.
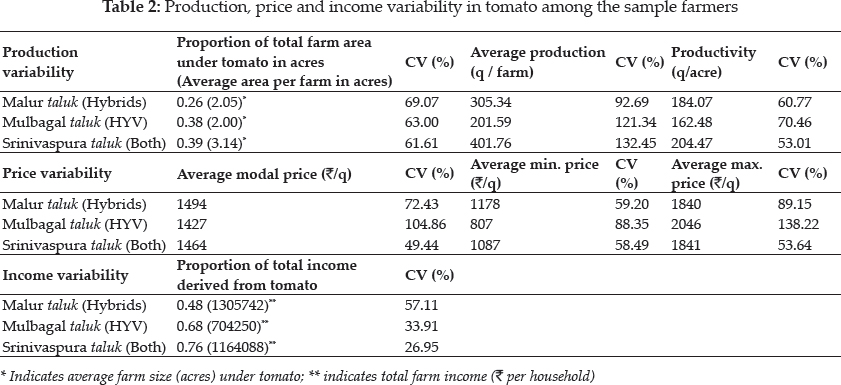
Tomato was the major commercial crop for farmers in the study area. Farmers grew other crops in addition to tomato to minimize variations in the income as tomato prices fluctuated more violently than any other crop. As the proportion of area under tomato to the total cultivated area decreased, the variability or risk measured in terms of co-efficient of variation (CV) increased. This showed that as the extent of land allocated to tomato increased, the risk decreased considerably perhaps due to the economies of scale operating in all the three taluks of the study area. The risk in average production of tomatoes per farm was higher for HYVs than for hybrids because of the yield advantage seen in the case of hybrid tomato. In the case of variability in average minimum, maximum and modal prices of tomato per quintal measured in terms of CV showed that, price risk was higher in all the three taluks for HYVs of tomatoes compared to hybrids under all the three pricing conditions (Table 2). This may be because HYVs of tomato had only domestic demand and they have low keeping quality or shelf-life as compared to tomato hybrids. Price risk for tomato farmers in Srinivaspura taluk was lowest mainly because they cultivated both hybrids and HYVs of tomato at specific seasons to meet the demand. Most of the farmers allocated the same land for growing hybrids and HYVs in two different patches to reduce their price risk and in anticipation of good price for either one of them.
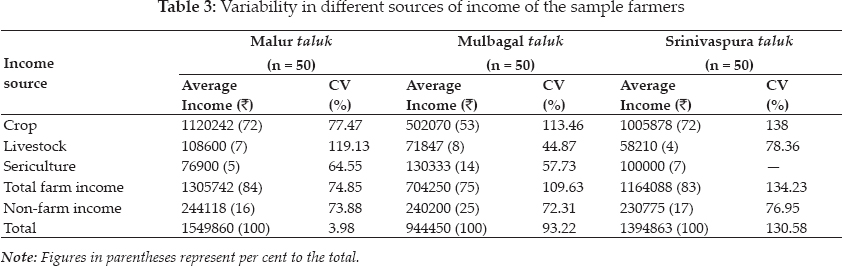
The variability in income was highest among livestock enterprise in Malur and contrasting results were seen in the case of Mulbagal where the variability in livestock income was lowest and lower in the case of Srinivaspura taluk. This may be because of only a small number of people were depending on livestock in Malur and farmers grew tomato hybrids which are of more demand and of lower risk. Apart from this, sericulture income had lower CV because of the stability in the flow of income. Thus it can be inferred that inclusion of livestock and sericulture in crop pattern led to stability to farm income. This result was in line with findings of Gajanana and Sharma (1994) showed that in Tumkur district of Karnataka, sericulture and dairy added stability to farm returns. Non- farm income also had a comparatively lower risk in all the three taluks of the study area compared to total farm income because non-farm income included regular salaried wages and shop keepers who earn stable incomes as compared to farm income. Share of total farm income was highest at 84 per cent in Malur where they cultivated hybrid tomatoes as the major crop followed by 83 per cent in Srinivaspura where farmers were growing both hybrids and HYVs and 75 per cent in Mulbagal where they grew only HYVs of tomato (Table 3).
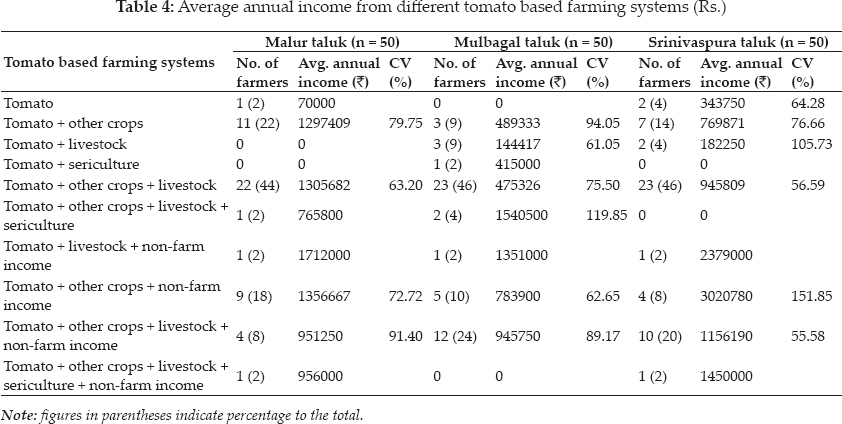
The analysis of risk associated with different types of tomato based farming systems (TBFS) revealed that tomato + other crops + livestock systems in the case of Malur had lowest risk of 63.20 per cent which was a predominant TBFS prevailing in the taluk. This was followed by tomato + other crops and tomato + other crops + non-farm income. The TBFS predominant in Malur taluk was also predominant in Mulbagal and Srinivaspura taluks which also had comparatively lower risk compared to other TBFS which may be due to inclusion of livestock component (Table 4). This was followed by tomato + other crops + livestock + non-farm income in both Mulbagal and Srinivaspura taluks. In all, the three taluks it was observed that the inclusion of livestock as a component under any TBFS lowered the income risk faced by the farmers compared to any other activity like sericulture or non- farm income. This may be due to the fact that the income from livestock especially dairy was more stable than any other farming enterprises.
The effect of diversification on variability in average annual income of the sample farmers was analysed using quantile regression and the results are presented in the table 5. Quantile regression is an alternative tool to ordinary least squares (OLS) regression in the case of presence of too many outliers or a heteroskedasticity condition. Here the regression was estimated at 5 different quantiles namely 0.10, 0.25, 0.50, 0.75 and 0.90th, (Meng et al., 2013) where the lower quantiles represent lower variability in income as compared to the upper quantiles which have relatively high variability in income of the farmers.
The variability in income was considered as the dependent variable as influenced by variables listed in Table 5. The variable CDI was significant across all the quantiles showing that as the degree of farm diversification increased, the variability in the total annual income of the farmers decreased as the risk was reduced when the income was diversified from different sources or enterprises. The extent of contribution of diversification on minimizing risk was highest at the lower quantiles as depicted by the regression coefficients for farmers who had less variability in income compared to those who had higher variability. The effect was lower because, the farmers who had higher income variability were those with lower degree of diversification. The effect of income from tomato was significant from 0.25th quantile. It was negative at this quantile to the farmers who had higher income from tomato and less income variability, exhibited lower degrees of variability in their total income. This result was in contrast with those farmers having higher variability at higher quantiles. This may be due to the fact that the farmers at lower quantiles have less income derived from tomato and contributed less to CV vis-à-vis farmers who were already at higher risk with high variability in income at higher quantiles.
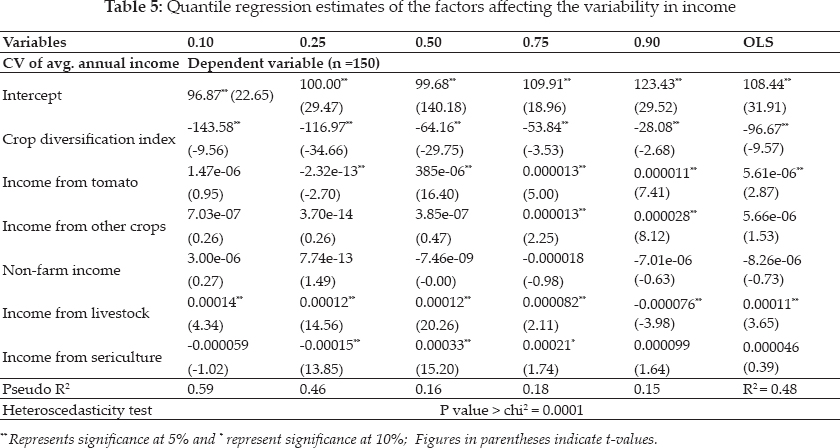
Further increase in income from tomato would increase their income risk. Farmers at lower quantiles were mostly those who were growing hybrid tomatoes with low variability in their annual income compared to those with upper quantiles who were growing HYVs of tomatoes who had comparatively higher CV of income. Increase in the income from other crops led to increase in variability of total income at upper quantiles where farmers had higher income variability. Income from livestock had positive and significant effect on variability in total income for farmers having low income variability at lower quantiles and in OLS regression. It also reduced the risk among the farmers who had higher income variability at upper 0.90th quantile because livestock income was more stable income for farmers growing HYVs of tomatoes who were prone to higher variability in their total income. Income from sericulture reduced the income risk at lower 0.25th quantile for farmers who had low income variability, but increased the risk in their total income for those farmers having higher income variability at upper 0.50th and 0.75th quantiles (Table 5).
CONCLUSION
Tomato was the major crop grown in the study area often facing the risks of price volatility. Diversification at different levels reduced the farm income risk for the tomato growers. Farmers having high and medium degree of diversification faced lower risk as compared to those farmers having lower degree of diversification. The results showed that, the inclusion of livestock and sericulture as subsidiary farm enterprises led to stability to farm income of tomato growers. Further, the effect of diversification on variability in average annual income of the sample farmers was analysed using quantile regression analysis. The results of quantile regression showed that as the degree of farm diversification increased, the variability in the total annual income of the farmers decreased. The extent of contribution of diversification on minimizing income risk was highest at the lower quantiles for farmers who had less variability in income compared to those who had higher variability representing upper quantiles. The effect of diversification in reducing risk was lower at upper quantiles because, the farmers at upper quantiles had higher income variability and were those with lower degree of diversification.
ACKNOWLEDGMENTS
Thankful to Department of Agricultural Economics, University of Agricultural Sciences, Bengaluru, Karnataka as this paper is a part of Ph. D. thesis research submitted.
REFERENCES
Adeoye, I., Yusuf, S. Balogun, O. and Alabuja, F. 2012. Application of game theory to horticultural crops in South-West Nigeria. ARPNJ. Agric. Biol. Sci., 7(5): 372–375.
Bansal, H., Sharma, S., Kumar R. and Singh, A. 2020. The Factors Influencing and Various Technological and Socio Economic Constraints for Crop Diversification in Haryana. Economic Affairs, 65(3): 409–413.
Gajanana, T.M. and Sharma. B.M. 1994. Farm planning under risk-MOTAD approach. Indian J. Econ, 75(1): 93–110.
Koenker, R. and Bassett. G. 1978. Regression quantiles. Econometrica, 46(1): 33–50.
Lokesh, G.B., Hari Shilpa G.R. and Chandrakanth. M.G. 2005. An economic analysis of tomato production, marketing and processing in Karnataka. Agric. Marketing, 47(4): 15–21.
Maharjan, A. 2002. Risk minimizing crop production strategy for northern dry zone of Karnataka. Thesis M.Sc. (Agri.). University of Agricultural Science, Dharwad, Karnataka, India.
Meng, T., Florkowski, W.J. Sarpong, D.. Resurreccion, A.V.A and Chinnan. M. 2013. The determinants of food expenditures in the urban households of Ghana: A quantile regression approach. Paper presented at Annual meeting. Southern agricultural economics association, Orlando, Florida, pp. 1–17.
Pal, S. and Kar. S. 2012. Implications of the methods of agricultural diversification in reference with Malda district: drawback and rationale. Int. J. Food, Agric. Veterinary Sci., 2(2): 97–105.
Saha, B. and Bahal, R. 2014. Livelihood diversification pattern among the farmers of West Bengal. Economic affairs, 59(3): 321–334.
Shashi Kiran, A.S. 2013. Risk in rainfed maize production in Karnataka- An econometric analysis. Thesis Ph.D. University of Agricultural Science, Bangalore, Karnataka, India.
Sichoongwe, K., Mapemba, L., Tembo, G. and Ng'ong'ola. D. 2014. The determinants and extent of crop diversification among smallholder farmers: A case study of Southern Province Zambia. J. Agric. Sci., 6(11): 150–159.