Economic Affairs, Vol. 65, No. 4, pp. 551-557, December 2020
DOI: 10.46852/0424-2513.4.2020.11
![]()
Research Paper
Performance and Stability Analysis of Spices and Spice Products Export from India
ABSTRACT
India exports spices from times ancient and is the largest producer, consumer and exporter of spices in the world. This study is contemplated during the two time periods viz., Pre NHM (1993-94 to 2004–05) and Post NHM (2005-06 to 2017–18). The overall trend in spices export in quantity was found to be lower in the Period I than in Period II and Period III. It implies that a lower growth rate in quantity (4.75%) of spices were being exported during Period-I, which increased in quantity (9.57%) of spices during Period-II. Highly stable market for spices and its products during Period I were oils & oleoresins and curry powder, in Period II chilli (quantity), mint products (quantity), oils & oleoresins (value) and curry powder (quantity and value). No commodity showed low instability during Period III. (1993-94 to 2017–2018).
Highlights
 The growth rate of spices and its product exports were found high, positive and highly significant in post-NHM as compared to pre-NHM.
The instability was foundrelatively low in period-II as compared to period-I in exports of spices and its products.
Keywords: Exports, growth rate, instability, spices, spice products
India is traditionally known as the spice bowl of the world. Spices are grownup in India in tropical and subtropical regions from ocean to an altitude of 1500 meters. It is grownup almost in all the states of India. India ranks 1st in both area and production of spices in world. The spices is cultivated in the largest area i.e. 3969390 hectares with production of 8413980 tonnes in year 2017–18.
The economic growth of a country depends on the performance of its different sectors. Foreign trade can be a powerful instrument for promotion of economic growth of a country. Exports promote the economy with increase in national income, the level of output and growth of the economy. India ranks first in both area and production of spices in world. India is one of the 20 leading exporters of agricultural products in the world. As per the International Trade Statistics 2011, published by the World Trade Organization (WTO), India's agricultural exports amounted to US $ 23.2 billion with a 1.7 per cent share of world trade in agriculture in 2011 (Anon., 2011). During 2017–18, India exported 1028060 tonnes of spices and spice products which were valued at around ₹ 17929.55 crore. Exports grew by per cent in terms of volume and per cent in terms of value. In terms of targeted exports the actual achievement is 100 per cent in terms of volume and 105 per cent in dollar terms of value. USA is the top export destination for Indian spices followed by Vietnam, China, UAE and Malaysia.
How to cite this article: Nagani, C.M., Vekariya, S.B. and Vekariya, D.J. (2020). Performance and Stability Analysis of Spices and Spice Products Export from India. Economic Affairs, 65(4): 551–557.
Source of Support: None; Conflict of Interest: None ![]()
MATERIALS AND METHOD
To examine the growth and instability in export of spices and its products from India, commodity wise export data were collected for the year 1993–2003 to 2017–18, which in turn, split into three periods viz. pre-NHM (Period I (1993-94 to 2004–05)), post-NHM (Period II (2005-06 to 2017–18)) and overall period (Period III (1993-94 to 2017–18)).
Growth rates analysis
Growth rate is used to measure the past performance of the economic variables in question and describe the trends in those variables over time. Growth rate is generally expressed in two forms, viz., linear and compound. The linear form is obtained by fitting a straight line to the yearly data and estimating the parameters. The compound growth rate is obtained by fitting a straight line to the logarithms of the data and estimating the slope of the line (Acharya et al. 2012).
Compound growth rate
The compound growth rates (CGRs) of spices and spice products export in India was calculated by using the exponential function of the following specification:

where,
Yt = Dependent variable (Export quantity/ export value); t = Time variable in years taking the value of 1, 2, 3,…,n; a = Intercept; b = Regression coefficient (1 + r)
For the purpose of estimation, the equation was expressed in logarithmic form.

The value of log b in equation (2) was computed using the formula,

where,
N = Number of years.
Subsequently, the compound growth rate (%) was computed using the formula,

Student ‘t’ test was used to determine the significance of the growth rates obtained for which, the following formulation was employed,

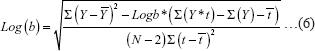
The calculated ‘t’ values, from equation (6), was compared with the table ‘f values and the significance was tested for 1 and 5 per cent probability levels.
Instability indices
In order to study variability in export trade of spices and spice products an index of instability index was used as a measure of variability. The coefficient of variation (CV) was calculated by using the following formula:

The trend coefficient was tested for its significance. Whenever, the trend coefficient was found to be significant, the variation around the trend rather than variation around mean was used as an index of instability. The formula suggested by Cuddy and Della (1978) was used to compute the degree of variation around the trend.

Where, Ix = Instability Index; CV = Coefficient of variation; R2 = Adjusted coefficient of multiple determination;
RESULTS AND DISCUSSION
Commodity-wise growth rates of spices and spice products export from India
Discussion was proceeded commodity wise and for each major spices and its products, each period was Performance and Stability Analysis of Spices and Spice Products Export from India discussed. Export volume and export value were discussed thoroughly. As shown in Table 1, pepper registered a negative growth rate in export quantity (-9.07%) and low negative export value (-4.79%) during Period-I. During Period-II, the growth rate were negative in export quantity (-2.20%) and positively significant in export value (16.29%) at 1 per cent level of significance. The increase in growth of value in Period-II over the Period-I was mainly because the effect of increase in unit value of realization. The similar trend was found in pepper by Mallika (2016) and Peter (1999).
Chilli registered a positive significant growth rate in both export quantity (12.77) and export value (16.46%) during Period-I. The growth rate was increased significantly in export value at 1 per cent significant level during Period-II and III. But, the growth rate was decreased significantly in export quantity during Period-II and Period-III. The similar trend was observed in chilli by Krishnadas (2010) and Peter (1999).
Turmeric rewarded a positive significant growth rate in both export quantity (5.11%) and export value (11.20%) at 1 per cent level of significance during Period-I. During Period-II, the growth rate was decreased in export quantity (1.60%) and significantly increased in export value (20.14%). The main reason of high growth of export quantity in turmeric during Period-I over Period-II because of the high demand coupled with inflation. The similar trend was reported in turmeric by Angles et al. (2011) and Peter (1999).
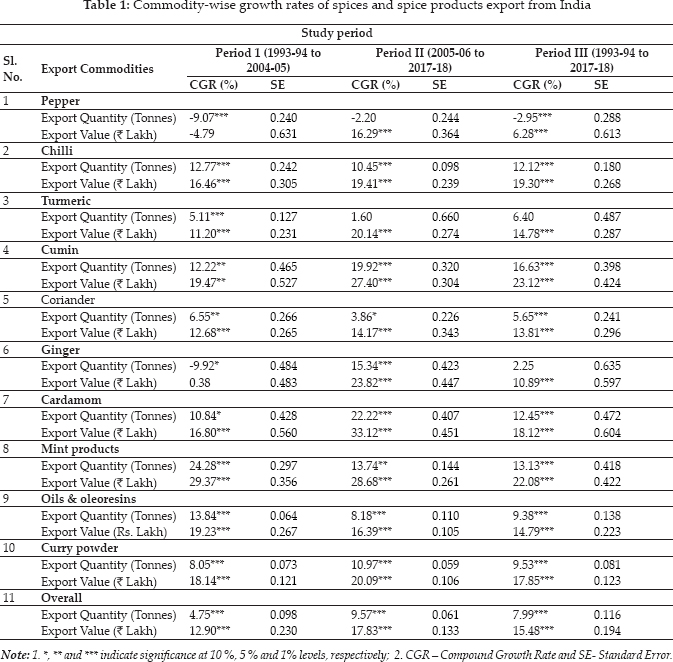
Cumin found with a positive significant growth rate in both export quantity (12.22%) and export value (19.47%) at 5 per cent level of significance during Period-I. During Period-II, Cumin registered a positive and highly significant growth rate in both export quantity (19.92%) and export value (27.40%) at 1 per cent level of significance. In Period-III, the growth rate were found positive and highly significant on both export quantity and export value. The main reason behind it because of increase in international demand of cumin.
Coriander depicted a positive significant growth rate in export quantity (6.55%) at 5 per cent significant level and found positive significant growth rate in export value (12.68%) at 1 per cent significant level during Period-I. But in Period-II, the growth rate was found decreased in export quantity (3.86%) over the period-I. This was may be due to increase in demand in domestic area. During Period-III turmeric registered a positive and significant growth rate in both export quantity (5.65%) and export value (13.81%).
Ginger resulted a negative growth rate in export quantity (-9.92%) during Period-I. But in Period-II the growth rate was registered positive and highly significant in export quantity (15.34%) at 1 per cent level of significance. The reason of negative growth rate during Period-I over the Period-II was the wide fluctuation in domestic production and crop failures. During Period-II the growth rate of export value (23.82%) was high over the Period-I because of the cumulative effect of the increase in unit value realization. The similar trend was found in ginger by Rajanbabu (2015) and Karthick et al. (2015)
Cardamom observed a positive significant growth rate in both export quantity (10.84%) and export value (16.80%) at 10 and 1 per cent level of significance, respectively during Period-I. During Period-II, the growth rate were found highly positive and significant in both export quantity (22.22%) and export value (33.12%) at 1 Per cent level of significance. The probable reason for low growth rate in export quantity during Period-I over Period-II might be the high cost of production, low quality, effective entry of Guatemala and in inconsistent policy of Government of India. The similar trend was observed in cardamom by Govindasamy (2015), Sharath (1993) and Guledgudda et al. (2014).
Spice Products like mint products and oils registered a highly positive and significant growth rate in both export value and export quantity during Period-I. But during Period-II, they found low growth rate in both export quantity and export value over Period-I except curry powder. The curry powder registered a high positive and significant growth rate in both export quantity (10.97%) and export value (20.09%) at 1 per cent level of significance during Period-II over the Period-II. This was may be due to the increase in international demand of curry powder and high quality of curry powder during Period-II.
Overall spices registered a low and highly significant growth rate in export quantity (4.75%) at 1 per cent level of significance level and registered a high and highly significant growth rate in export value (12.90%) at 1 per cent level of significance during Period-I. During Period-II, overall spices registered a medium and highly significant growth rate in export quantity (9.57%) at 1 per cent level of significance and registered a high and highly significant growth rate (17.83%) at 1 per cent level of significance. In Period-III, the registered growth rate was medium and highly significant in export quantity (7.99%) at 1 per cent level of significance and the growth rate was high and highly significant in export value (15.48%) at 1 per cent level of significance. The similar trend was reported by Rajanbabu (2015).
The growth rate of exports in terms of quantity and value were found high, positive and highly significant in the post-NHM (1993-94 to 2004–05) phase when compared to pre-NHM (2005-06 to 2017–18) regims (Table 1). This was may be due to impact of National Horticultural Mission. Because, after the NHM Period increase in production and productivity of spices, effective international export policy, better infrastructure facilities of storage, etc. So, the growth rate in terms of export quantity and export value were found increased during post-NHM over the pre-NHM.
Instability analysis in export of spices and spice products export
The agricultural instability can be measured by different methods, such as the coefficient of variation (CV), dispersion, Cuddy Della Valle Index (CDV), etc. The current study put on the Cuddy Della Valle Index and coefficient of variation for quantifying the instability. This Index first de-trends the given series and gives a clear direction about instability. The present study divides the CDV values into three categories, which represent the different range of instability (Sihmar, 2014). The ranges of instability are as follows:
◆ Low instability = between 0 to 15
◆ Medium instability = between 15 to 30
◆ High instability = greater than 30
Commodity-wise instability of spices and spice products
Managing and stabilizing export instability is a priority for the exporting countries to maximize earnings. The results of instability analysis are presented in Table 2. The study observed that instability in the spices and its products export of turmeric (export quantity), oils & oleoresins and curry powder remained low during the Period I and pepper (export quantity), chilli (export quantity and value), turmeric (export value) and coriander (export value) registered medium measures of instability. Pepper (export volume), cumin, ginger, cardamom and mint products showed higher instability. These all were remained more unstable commodities throughout the study period.
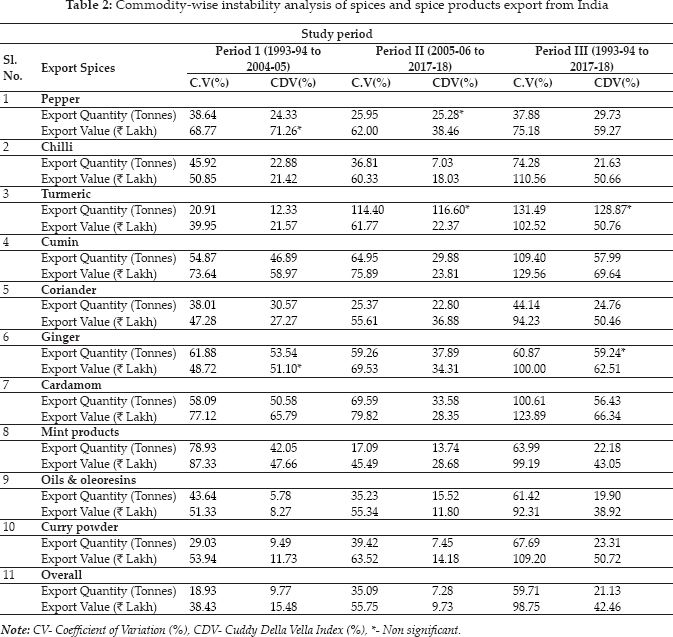
Pepper (export value), turmeric (export quantity), coriander (export value), ginger (export quantity and value), and cardamom (export quantity) showed higher instability in Period II. But, the instability trend was declined in Period-II over the Period-I. Turmeric (export quantity) registered to be highly unstable commodity which was noticed under low instable commodity during previous period. Cumin registered a high instability in export quantity and export value during Period-I. But During Period-II, cumin registered a medium instability in both export quantity and export value. Mint products registered a low instability in export quantity and medium instability in export value in Period-II which were more unstable in both export quantity and export value during Period-II. The trend for instability in spice products export in curry powder (export quantity) declined in Period II. This had low instability during the Period II. Above of all spices and its products, pepper (export quantity), turmeric (export quantity and value), oils & oleoresins (export quantity and value) and curry powder (export value) registered a high instability during Period-II over the Period-I.
In Period-I, overall spices and spice products registered low or medium instability in both export quantity and export value. During Period-II, the instability was low with declined rate in export quantity and export value of overall spices and spice products over the previous period. The reasons for high instability might be inconsistent domestic production, consumption and international demand. The above finding is in line with Geetha and Srivastava (2018).
During 1993–94 to 2017–18, It can be seen from the table that there was no commodity under the low instability category which is the most undesirable situation. In pepper (export quantity), chilli (export quantity), coriander (export quantity), mint products (export quantity), oils & oleoresins (export quantity) and in curry powder (export quantity) medium instability was recorded during Period III. Whereas turmeric, ginger and cardamom are the most unstable commodities in terms of export quantity and export value. The highest instability was observed in Period III measured by both the methods, i.e. CV and CDV, could be noticed for the quantity of turmeric exports. The probable reason for the highest instability observed in case of export of quantity in turmeric exports may be due to the turmeric importing countries have their own production or may be inconsistence export policy of Govt. of India in turmeric. The variability of its own turmeric production directly reflected in India's turmeric export. The similar results were found by Joshi et al. (2015).
Curry powder depicted lower instability, so more reliable destined commodity for Indian spice products. In general, Period I registered high instability when compared with Period-II. This is due to the fact that after NHM, Indian exports were accepted by developed countries because of development in storage infrastructure. So, the quality and tastes of spices and spice products are remaining naturally and other reason of low instability was banned of harmful pesticides in horticultural products. The similar instability trend was reported by Darekar et al. (2015).
CONCLUSION
The highest growth rate was found in mint products both in export quantity and value during Period-I. During Period-II, cardamom registered a highest growth rate in both export quantity and value. Overall spices registered a positive and significant growth rate during all the periods. During Period-II, the overall spices growth rate was increased due to impact of National Horticulture Mission. The overall trend in spices export in quantity was found to be lower in the Period I than in Period II and Period III. It implies that a lower growth rate in quantity (4.75 %) of spices were being exported during Period-I, which increased in quantity (9.57 %) of spices during Period-II. Highly stable market for spices and its products during Period I were oils & oleoresins and curry powder, in Period II chilli (quantity), mint products (quantity), oils & oleoresins (value) and curry powder (quantity and value). No commodity showed low instability during Period III.
REFERENCES
Acharya, S.P., Basavaraja, H., Kunnal, L.B., Mahajanashetti, S.B. and Bhat, R.S. 2012. Growth in area, production and productivity ofmajor crops in Karnataka. Karnataka Journal of Agricultural Sciences, 25(4): 431–436.
Angles, S., Sundar, A. and Chinnadurai, M. 2011. Impact of globalization on production and export of Turmeric in India - An Economic Analysis. Agricultural Economics Research Review, 24(2): 301–308.
Anonymous. 2011. Agricultural Processed food Export Development Agency database. Available at: www.apeda.gov.in. Accessed on:
Darekar, A.S., Pokharkar, V.G., Datarkar, S.B. and Patil, S.G. 2015. Performance and competitiveness of onion export from India. International Journal of Tropical Agriculture, 33(2): 1095–1099.
Geetha, S.R. and Srivastava, S.K. 2018. Export of maize from India: Performance and determinants. Asian Journal of Agricultural Extension, Economics & Sociology, 29(1): 1–11.
Govindasamy, R. 2015. Production and export performance of cardamom in India. Shanlax International Journal of Management, 4(2): 75–86.
Guledgudda, S.S., Patil, B.L. and Rajur, B.C. 2014. Export performance of Indian cashewnut - An analysis. Economic Affairs, 59(4): 669–674.
Joshi, D., Singh, H.P. and Gurung, B. 2015. Stability analysis of Indian spices export - A Markov Chain approach. Economic Affairs, 60(2): 257–262.
Karthick, V., Alagumani, T. and Anbarassan, A. 2015. Growth and export performance of ginger in India - An economic analysis. Economic Affairs, 60(2): 207–214.
Mallika, K.L.P. 2016. Export performance of pepper in India. Ph.D. (Agri-business management) Thesis, submitted to University of N.G. Ranga, Guntur, Andhra Pradesh (India).
Peter, K.V. 1999. Spices: Makings of a global leader. Survey of Indian Agriculture, 21(4): 81–84.
Rajanbabu, R. 2015. Production and trade performance of spices grown in India. International Journal of Commerce, Arts and Science, 6(9): 29–45.
Sharath, B.T. 1993. An analysis of India's export trade in cardamom. M. Sc. (Agri.) Thesis, University of Agricultural Science, Bangalore, Karnataka (India).