Economic Affairs, Vol. 65, No. 4, pp. 559-573, December 2020
DOI: 10.46852/0424-2513.4.2020.12
![]()
Research Paper
Rice Yield Differentials between IFAD Participating and Non-Participating Farmers in Nigeria's Niger State
ABSTRACT
The research empirically determined rice yield differentials between the IFAD participating and non-participating farmers in Nigeria's Niger state. A field survey data of 2018 cropping season collected through structured questionnaire complemented with interview schedule from 111 participants and 185 non-participants sampled via a multistage sampling technique were used. The collected data were analyzed using descriptive statistics, profit function and inferential statistics. The empirical findings showed that the participating farmers are efficient in managing their enterprise risk owing to low cost of production and high yield. In addition, the programme had impact on the farmers’ productivity both in the short-run and long-run, thus the reason for the high yield in comparison to their counterparts. Furthermore, the decomposition analysis justified the impact of the programme as structural difference called programme participation accounts for more than 92% variation in the yield of the participating farmers been higher than that of the non-participating farmers, leaving less than 10% to be contributed by resource endowment difference. Therefore, the study advised the participating farmers to increase their insurance coverage and adjust their structural pattern of production as a risk management strategy so as to enhance their chances of breaking even in rice production. In addition, the programme should be broaden to cover the non-treated groups so as to enhance the livelihood and rice food security of the farming households in particular; and that of the rural, state and national economies in general.
Highlights
 Quantifying yield gap between programme participants and non-participants
Determining the effect and impact of IFAD programme on farmers yield
Keywords: Yield Differential, Rice, Farmers, IFAD, Nigeria
Around 1.5 billion people worldwide work in smallholder farming (Abdullahi et al. 2015). They include 75 % of the world's poorest people, whose prospects for food, income and livelihood depend on agriculture (Andrea 2014; Abdullahi et al. 2015). Peasantry is Nigeria's dominant mode of agricultural production and subsistence, with more than 70 percent of the population engaged as a profession in agricultural activities and primarily feeding the nation (Atala and Hassan, 2012). Schubert (1994); Abdullahi et al. (2015) reported that agriculture is the main source of income for the poor, and that poverty amongst these smallholder farmers is perhaps more prevalent. Reducing poverty in the country would not be feasible without a fast increase in agriculture. Babatunde (2006) reported that the concern about growing levels of poverty, especially in developing countries such as Nigeria, and the need to alleviate it as a means of improving people's living standards, led to the conceptualization and implementation of various poverty alleviation programs worldwide.
How to cite this article: Sadiq, M.S., Singh, I.P. and Ahmad, M.M. (2020). Rice Yield Differentials between IFAD Participating and Non-Participating Farmers in Nigeria's Niger State. Economic Affairs, 65(4): 559–573.
Source of Support: None; Conflict of Interest: None ![]()
Over the past couple of decades the government and international agencies such as the International Fund for Agricultural Development (IFAD) have embarked on multiple intervention programs to tackle the problems of hunger, food insecurity and also improve the quality of life of rural citizens. The government's main worry in embarking on the aided projects of the IFAD is to reduce poverty among rural Nigerians by increasing their income (IFAD, 2013). The project has been extremely focused in targeting the poorest sectors of landless and small-scale farmers. One of its goals is through participatory mechanism to alleviate rural deprivation and food insecurity among the most vulnerable families in the country's environmentally sensitive areas.
Increased agricultural productivity, the shift from subsistence to commercialized farming and increased market access are considered as some of the ways to make the farming sector a viable enterprise, particularly in the study area and Nigeria in general. Very often, the prevalence of market imperfections in the markets of both input and output ration small and marginal farmers and endanger their sustainability. These show that many challenges exist when it comes to making agriculture remunerative, effective, competitive and sustainable. Future stress is expected on the resources for agricultural production. Consequently, the requirement of increased production can be met primarily by increasing agricultural productivity and efficiency. With climate change and globalisation, agricultural risk management and uncertainty are inevitable in the future.
It is view of the foregoing that this study attempts to determine the structural effect of farmers’ participation in IFAD rice programme on their productivity gap. The specific objectives were to determine the risk management efficiency of the participating farmers vis-à-vis the non-participating farmers; to determine the effect and impact of the programme on the farmers yield; and, to determine the effect of the programme on the yield gap of the participating farmers.
RESEARCH METHODOLOGY
The study was conducted in Niger state of Nigeria situated on latitudes 8°20'N and 11°30'N of the equator and longitudes 3°30'E and 7°20'E of the Greenwich Meridian time. The vegetation of the state is northern guinea savannah with a sparse of southern guinea savannah. Agriculture is the major occupation in the study area and it's complemented with civil service jobs, artisanal, craftwork, Ayurveda medicines and petty trade.
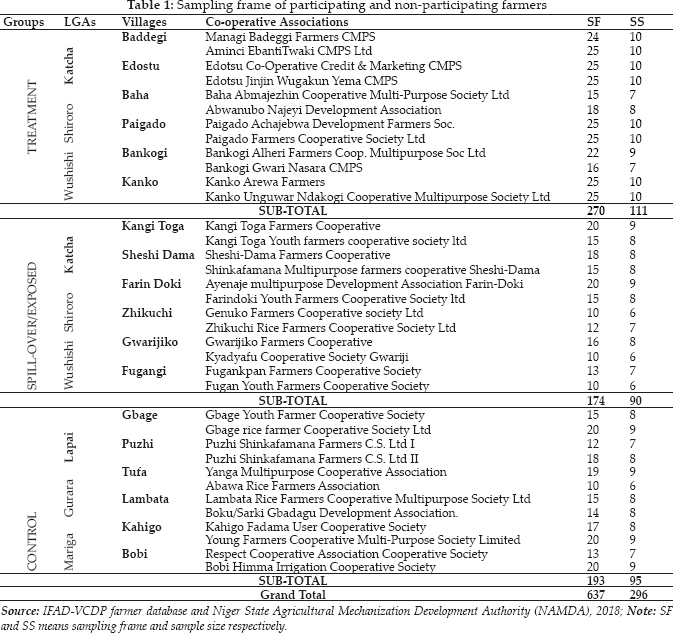
The present study relied on cross sectional data obtained from 296 rice farmers drawn viz. multi-stage sampling technique using sampling frame obtained from IFAD-VCDP, NAMDA and reconnaissance survey. In the state, only five (5) Local Government Areas were involved in the IFAD rice programme with Agricultural Zone A (Bida) and C (Kontagora) having two LGAs each, namely Bida and Katcha; and, Wushishi and Kontagora respectively, while Zone B has one participating LGA viz. Shiroro. In the first stage, for Agricultural Zone A, one LGA viz. Katcha LGA was randomly selected; for Zone B, the only participating LGA viz. Shiroro LGA was automatically selected; while for Zone C, Wushishi LGA was purposively selected based on its’ comparative advantage given that rice is produce throughout the year owing to the presence of Tungan Kawo irrigation dam. The sample size used for the study was composed of three groups of respondents viz. treatment group (IFAD participating farmers), exposed/spill-over group (non-IFAD participating farmers but living within the radius of 50km of IFAD site as adopted by Irshad et al. 2016) and the control group (neither IFAD participants nor living within the radius of 50km). In the same vein, the exposed group emanates from the selected IFAD participating LGAs while one LGA from each of the Agricultural zones viz. Lapai (Zone A), Gurara (Zone B) and Mariga (Zone C) were selected as control units.
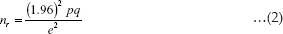
In the second stage, two villages were randomly selected from each of the chosen participating LGAs, exposed sites and the control LGAs. Thereafter, two active co-operative associations from each of the selected participating; exposed and control villages were randomly selected. It is worth to note that Microsoft excel inbuilt random sampling mechanism was used for the random selections of the villages and the co-operative associations. In the last stage, using the sampling frame obtained from IFAD/VCD office in Niger State and developed from reconnaissance survey (Table 1), Cochran's formula was used to determine the representative sample size. Thus, a total of 296 active rice farmers form the sample size for the study. However, only 295 questionnaires were found valid for analysis. Structured questionnaire complemented with interview schedule was used to elicit information from the respondents during the 2018 cropping season. In synchronizing order, the objectives were achieved using profit function and risk enterprise analyzer; WLS in conjunction with Chow F-test statistics and ATE; and WLS in conjunction with Oaxaca-Blinder decomposition model. The Cochran's formula used is shown below:
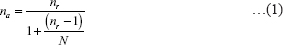
Where:
na = adjusted sample size for finite population; nr =
sample size for infinite population; N = population size; p = proportion of population having a particular characteristic; q = 1 - p; e2 = error gap (0.07).
Thus, p = 0.40 and q = 1 - 0.40 = 0.60
Empirical model
1. Profit Function
A prototype of the profit function is given below:


Where,
GM = Gross margin; n = Profit; TR = Total revenue; TVC = Total variable cost; and, TVC = Total cost
2. Multiple Regression
Shown below is the multiple regression model:
Implicit form

Explicit form
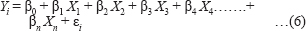
Where, Y = Output of rice (kg); X1 = Seeds (kg); X2 = NPK fertilizer (kg); X3 = Urea fertilizer (kg); X4 = Herbicides (litre); X5 = Family labour (man day); X6 = Hired labour (man day); X7 = Depreciation on capital items (N); X8 = Farm size (ha); β0 = Intercept; β1-8 = Regression coefficient; and, εt = Stochastic
The functional forms fitted into the specified equation are as follow:
(a) Linear function
MPP = β
Elasticity = $* X/ Y
(b) Semi-log function
MPP = β*  /
/
Elasticity = β
(c) The Cobb Douglas (double log) function
MPP = β* /
Elasticity = β
(d) Exponential function
MPP = β*
Elasticity = β*
3. Chow F-statistics test
Following Onyenweaku (1997); Amaefula et al. (2012), the F-statistics tests for Test for Effect of the programme, Test for Homogeneity of slopes and Test for Differences in intercepts are given below:
To isolate the effect of the programme, Equation 6 was used to estimate for: (i) for participating farmers (ii) non-participating farmers (iii) pooled data without a dummy variable (iv) pooled data with a dummy variable (participants =1, otherwise = 0)
Test for Effect of the programme:
Where and are the error sum of square and degree of freedom respectively for the pool group (both treated and untreated), and are the error sum of square and degree of freedom respectively for the treated group, and,  and K2 are the error sum of square and degree of freedom respectively for the untreated group.
If the F-cal is greater than the F-tab, it implies that the programme had effect on the participation attitude of the treated group.
Test for Homogeneity of Slope:
Where  and K4 are the error sum of square and degree of freedom respectively for the pooled group (both treated and untreated) with a dummy variable.
If the F-cal is greater than the F-tab, it implies that the programme brought about a structural change or shift in the participation behaviour parameter.
Test for differences in intercepts:
If the F-cal is greater than the F-tab, it implies that the participation attitudes of the treated farmers differ from that of the untreated group.
4. Average Treatment Effect (ATE)
ATE: It show the average difference in outcome between units assigned to the treatment and units assigned to the placebo (control). Following Lokshin and Sajaia (2011); Wang et al. (2017) the equation is given below:
Income of participants is given by:

Income of non-participants is given by:

Income of participants if they had not participated is denoted by:

Income of non-participants if they had participated:

Where:
E(.) = Expectation operator
y1i = Yield of participants (dependent variable)
y2i = Yield of non-participants (dependent variable)
I = Dummy variable (1 = participant, 0 = non-participant)
X = Explanatory variables that is common to both participants and non-participants.


Average Treatment effect on Treated = ATT
Average Treatment effect on Untreated = ATU
Equations (12) and (13) were further simplified as:
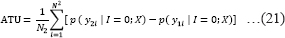
Where, N1 and N2 are number of participants and non-participants respectively and p = probability.
5. Oaxaca-Blinder Decomposition model
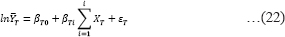
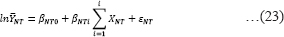
Following Marwa (2014); Revathy et al. (2020) the extent to which the yield gap between the treated and untreated farmers can be explained by differences in observed capital resources estimated using the standard Oaxaca-Blinder procedure (Oaxaca 1973; Blinder 1973) is as follows:
Where,
T = average yield of treated group;
NT = average yield of non-treated group;
Xi-n = explanatory variables;
β0 = intercept;
βi-n = parameter estimates; and, εi = stochastic term.
The Oaxaca-Blinder decomposition as cited by Revathy et al. (2020), equations 22 and 23 can be explained as follow:
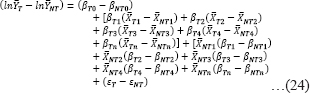
The yield gap is divided into two segments: one is the proportion attributable to differences in the endowments of income-generating activities (T-NT) evaluated at the treated group returns (βT). This is taken as a reflection of endowment differential and it's termed endowment or explained effect. The second segment is attributable to the difference in the returns ($Tn - $NTn) that the treated and untreated groups get for the same endowment of income-generating activities (XNT). This segment is often taken as a reflection of discrimination or income differential and its termed discrimination/structural/ unexplained effect.
RESULTS AND DISCUSSION
Enterprise Risk Analysis/Enterprise Risk Managerial Efficiency between the IFAD Group and Non-IFAD Groups
The enterprise net income risk analysis results for both the whole farm and individual enterprises are shown in Table 2. The net income for the whole farm ranges from a negative  55999.28 to a positive 2166858.12, with a positive 715204.32 being the most likely net income across all the enterprises (Table 2c). Besides, the net cash income ranges between a positive value of 158136.01 and 2380993.41, with the most likely net cash income at 929339.61 across all the enterprises. All the enterprises had a positive net income cum net cash income for the most likely outcome with the income of IFAD participants been higher that of the both non-treated groups. The most likely net income cum net cash income for the treated group is 361821.30 and 424485.08 respectively; while that of the spillover group and the control group are 212608.66 and 277282.67, and, 140774.36 and 227571.86, respectively; thus making the net income cum net cash income of the treated group to be higher than that of the spill-over and control groups by 41.24% and 34.68%; and 61.09% and 46.39%, respectively.
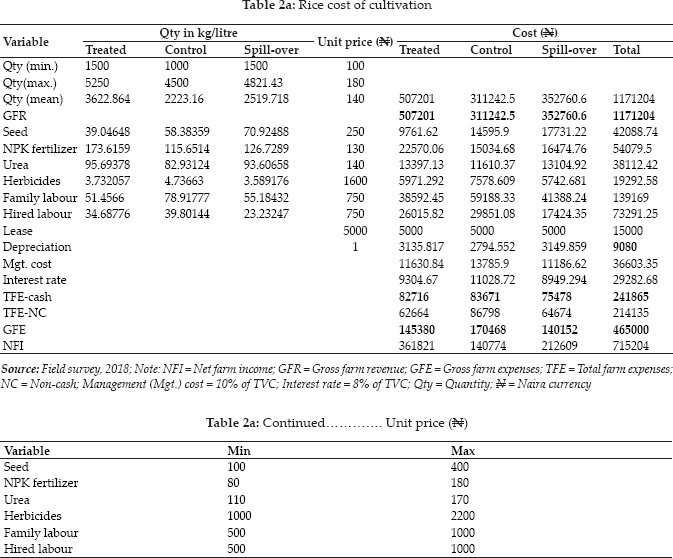
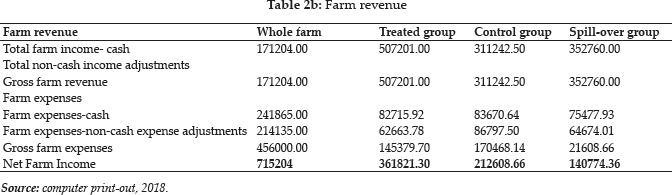
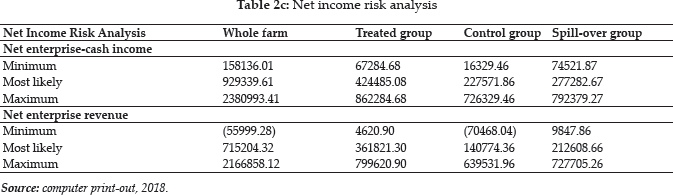
For the minimum estimate, the enterprises of treated and the spill-over groups recorded a positive net income cum net cash income while the enterprise of the control group recorded a negative net income and a positive net cash income. For the maximum estimates, all the enterprises recorded a positive net income cum net cash income.
On a whole farm basis, the rice enterprise is most likely to earn a net return between a positive 684950 (p = 0.073) and a positive 759050 (p= 0.073) on a net income basis, and between a positive 899090 (p = 0.073) and a positive 973180 (p = 0.073) on a net cash income basis. For the IFAD enterprise, the technical unit is most likely to generate a net income cum net cash income between a positive 349120 (p = 0.073) and a positive 375620; and a positive 411780 (p = 0.073) and a positive 438280 (p = 0.072), respectively. In addition, for the spill-over group, a technical unit is most likely to generate a net income cum net cash income between positive values of 201280 (p = 0.074) and 225210 (p = 0.074); and, 265950 (p = 0.074) and 289880 (p = 0.074), respectively. Lastly, for the control group, a technical unit is most likely to earn a net income cum net cash income between a positive values of 142530 (p = 0.074) and 166200 (p = 0.073); and, 229330 (p=0.074) and N253000 (p = 0.073), respectively.
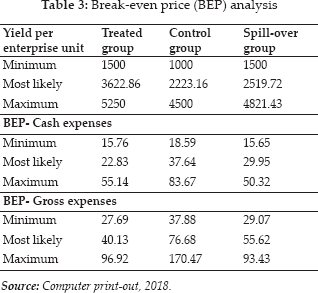
Evaluating Break-Even Analysis between the IFAD Group and Non-IFAD Groups
A cursory review of the results showed that for the treated group, the most likely break-even price of rice per kg is 40.13 to cover gross expenses and 22.83 to cover only cash expenses. For the control group, the most likely break-even prices of rice per kg are 55.62 and 29.95 respectively, to cover gross expenses and only cash expenses for the former and latter. Also, for the control group, the most likely break-even prices to liquidate both the gross expenses and only cash expenses are 76.68 and 37.64 respectively. Since the breakeven price represents the cost of production, thus it can be inferred that the treated group had the lowest cost of production, thus the most efficient technical unit (Table 3).
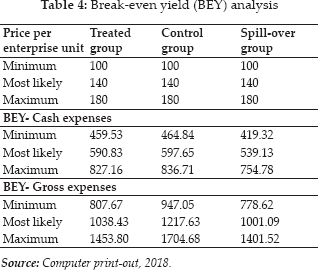
Furthermore, the results showed the break-even yield for the treated both for the net income and net cash income bases to be 1038.43kg and 590.83kg respectively. For the spill-over group and the control group, their break-even yields at net income cum net cash income are 1001.09kg and 539.13kg; and, 1217.63kg and 597.65kg, respectively. On the basis of break-even yield, it can be inferred that the impact of the programme made the treated group to have a higher break-even yield that the non-treated groups (Table 4).
Probability analysis is another important ERA feature for evaluating enterprise performance; allowing the farmers to examine the likelihood of various price and yield levels to cover either only cash or gross (cash and non-cash) expenses or both. The probability curve shows the probability of breaking even at a given price or yield for a technical unit. Examining the rice technical unit of the treated group, the result shows that there is a 51% probability of breaking even at approximately 46.15 per kg for gross expenses and 26.26 per kg for cash expenses. For the spill-over group and the control group, the probability of breaking even at 59.11 per kg for gross expenses and N31.83 per kg for cash expenses is 57%; and, the tendency of breaking even at 86.50 per kg for gross expenses and 42.46 per kg for cash expenses is 54%, respectively.
Furthermore, on the yield basis, for the treated group, the result reveals that there is 51% probability of breaking even at 1066.10kg for gross expenses and 606.6kg for cash expenses. While for the spillover and the control group, the results indicate that there is 51% probability of breaking even at 1027.8 kg for gross expenses and 553.5kg for cash expenses; and, 1250.10 kg for gross expenses and 613.60kg for cash expenses, respectively. Therefore, from the above findings, for risk management strategy, in order to improve the chances of enhancing the breaking even, the treated group should increase their insurance coverage and adjust their production structural pattern, while the non-treated groups should adjust their level of production.
Summary of the Productive Resources
On per hectare basis, given that the treatment group used improved rice seed variety, the quantity of seed utilization was lower (39.1kg) than that of the non-treatment group by (64.17kg) (Table 2a). In addition, access to adequate supply of inorganic fertilizer for increased productivity makes the quantity utilized by the treatment group to be higher than that of the non-treatment group. The reason for the adequate access is due to the facilitating functions of the IFAD programme: linking the treatment group with the input supplier i.e. backward market linkage, thus gives them pecuniary advantage of bulk discount; and, credit provisions. Furthermore, on the average, the quantity of the rice productivity of the treatment group was higher than that of the non-treatment group by 34.86%. Therefore, it can be suggested that the programme support viz. technical and financial services made the treatment group to have head advantage in respect of access to adequate tradable inputs and yield than the non-treatment group.
Determinants of Production vis-à-vis Treated Group and Non-Treated Groups
The results of the OLS estimation was inefficient to make the best fit functional forms to be a classical normal regression given that they failed the test of homoscedasticity, thus the weighted least square (WLS) estimation was applied and the best fit functional forms became a classical normal regression (Table 5). Therefore, it suffice that the chosen functional forms viz. linear for the treated group, control group and pooled (non-treatment); and, double logarithm for the spill-over group were reliable for predictions with certainty and accuracy.
The coefficients of multiple determination for the treated group, control group, spill-over group and pooled (non-treated) were 0.7908, 0.6796, 0.7623 and 0.6223 respectively. Thus, it implies that 79.08%, 67.96%, 62.23% and 62.23% of the variation in the output of the treated, control, spill-over and pooled (non-treated) groups were influenced by the inputs captured in their respective models while the disturbed economic reality accounts for the remaining percentages.
The results showed that the output of the treated group was significantly influenced by NPK fertilizer, human labour and farm size as evident by their respective parameter estimates which were different from zero at 10% degree of freedom. In addition, all these significant variables had positive effect on the rice output of the participants, thus an indication of rational application of these productive resources.
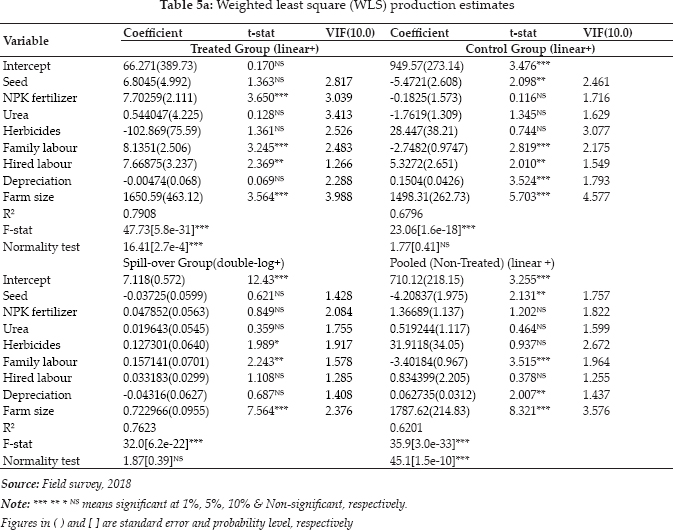
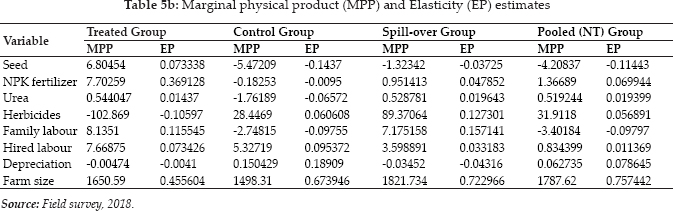
Despite cultivating rice on a small-scale basis, the farmers had pecuniary advantage viz. economies of scale. However, the non-significant of the improved seed, urea and herbicides indicate insufficient dosage application owing to poor productivity of capital despite the programme credit support; while that for the depreciation on capital items revealed rudimentary of the farm implements used in the cultivation process. The marginal and elasticity implications of a unit increase in NPK fertilizer, family labour, hired labour and farm size would lead to an increase in output by 7.70kg and 0.37%; 8.14kg and 0.12%; 7.67kg and 0.07%; and, 1650.59kg and 0.46%, respectively.
The rice output of the controlled group was significantly influenced by seeds, human labour, depreciation on capital items and farm size as indicated by their respective parameter estimates which were within the plausible margin of 10% degree of freedom. In addition, seeds and family labour decreased the output level of rice; while hired labour and a host of the remaining significant variables increased the output level of rice. The marginal and elasticity implications of a unit increase in seeds and family labour would decrease output by 5.47kg and 0.14%; and, 2.75kg and 0.10% respectively, while a unit increase in hired labour, depreciation on capital items, and farm size would increase output by 5.37kg and 0.10%; 0.15kg and 0.19%; and, 1498.31kg and 0.67% respectively. Therefore, it can be inferred that the farmers used local seed varieties and excess of family labour was deployed on the rice farms, thus affecting rice output. The meticulous use of hired labour due to its cost implication i.e. it is not free and cheap; pecuniary advantage viz. economies of scale despite been smallholder; and, replacement and judicious use of rudimentary tools of cultivation increased the farmers’ output.
In the case of the spill-over group, the farmers’ output level was significantly influenced by herbicides, family labour and farm size as evidenced by their respective parameter estimates which were within the acceptable margin of 10% degree of freedom. In addition, it was observed that these significant inputs increased the output level of rice, thus indicating adequate utilization of these productive resources. Thus, the marginal and elasticity implications of a unit increase in herbicides, family labour and farm size would increase output by 89.37kg and 0.13%; 7.18kg and 0.16%; and, 1821.73kg and 0.72% respectively. Therefore, it can be inferred that herbicides was adequate and it was applied based on the recommended dosage to substitute the manual drudgery of weeding; and the excess labour which is common to a typical traditional farming setting in the studied area was channeled into alternative use, thus increasing rice output. In addition, despite that the farmers cultivated rice on a small-scale basis, they benefitted from the economies of scale.
For the pooled (non-treated) group, it was observed that the rice output level was significantly influenced by seed, family labour, depreciation on capital items and farm size as indicated by their respective coefficients which were within the acceptable margin of 10% degree of freedom. In addition, the use of local seed varieties and excess of family labour because it is free, they tends to have a negative effect on the output level. Despite the fact that the farmers produce rice on a small-scale basis, they tend to benefit from economies of scale. In addition, despite that the farmers used primitive implements to cultivate rice, their output level increased. Therefore, the marginal and elasticity implications of a unit increase in seed and family labour will lead to a decrease in output by 4.21kg and 0.11%; and, 3.40kg and 0.10% respectively, while a unit increase in depreciation on capital items and farm size will lead to an increase in output by 0.06kg and 0.08%; and, 1787.62kg and 0.76% respectively.
Despite the non-programme intervention, the non-treated groups were efficient managers while the treatment groups inspite of the technical and financial supports, they were not efficient managers as indicated by the significant and non-significant of the managerial efficiency parameters of the former and latter, respectively. The non-significant of the treated group may be largely due to inadequate economic capital as well as social capital.
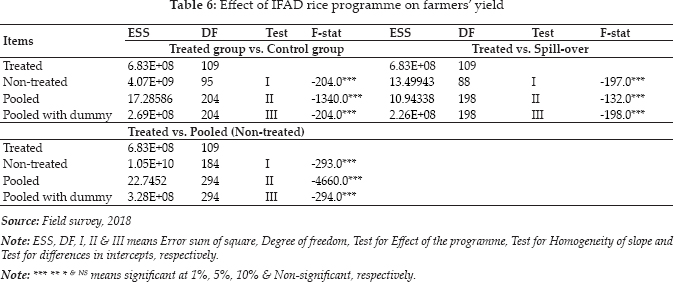
Effect of IFAD on Participating Farmers’ Production
A perusal of the Table 6 showed that the programme had effect on the output of the participating farmer when compared to that of their counterparts in control, spill-over and the pooled (non-treated) groups as indicated by the significance of their respective Chow F-statistics which were different from zero at 1% degree of freedom. In addition, the empirical evidence confirmed the presence of heterogeneity in the slopes of the production between the treated group vis-à-vis the non-treated groups as evidenced by the significance of their respective Chow F-statistics at 1% probability level. This implies that the slopes of the production functions are heterogeneous i.e. different and not homogenous. The heterogeneity of the slopes indicates that the production functions are factor-biased. Therefore, it can be inferred that the programme brought about a structural change in the production process of the treated group. In addition, there is a shift in the production attitude of the participating farmers. It was observed that there is heterogeneity i.e. differences between the intercepts of the treated and untreated as indicated by the significance of the Chow F-statistics at 10% degree of freedom. Therefore, it can be inferred that the programme made the attitude of the participants viz. the technological practices of the treated group to be different from that of the non-treated group. This confirmed the earlier submission which revealed that the participating farmers were not managerially efficient as compared to their counterparts (non-treated) group, thus indicating complexity in the comprehension of the programme technological practices. Thus, the programme should harp more on their technical services so as to ease the use of these technological practices.
Impact of IFAD Programme on Participating Farmers’ Yield
A perusal of Table 7 on the impact of the programme on the yield between the treated group and the control group showed that the ATE and the ATET coefficients for all the estimation methods were within the acceptable margin of 10%, thus indicating that the programme had impact on the yield of the participating farmers both between and within, programme on farmers’ yield respectively. Thus, programme participation made the yield of the treated group to be higher than that of the control group by 1136.18kg as revealed by the ATE regression adjustment coefficient.
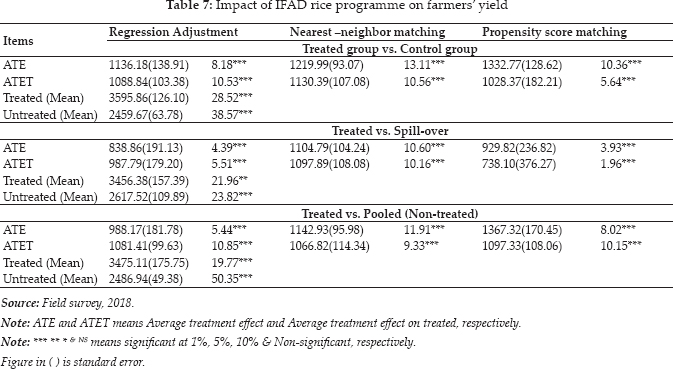
Between the treated group and the spill-over group, the programme had impact on the yield of the participating farmers both between and within as revealed by the ATE and the ATET coefficients for all the estimation methods respectively, which were different from zero at 10% degree of freedom. The impact of the programme made the yield of the participating farmers to be higher than that of the spill-over group by 838.86kg as evident by the ATE regression adjustment coefficient.
Furthermore, between the treated group and the pool (non-treated) group, it was observed that the programme impacted on the yield of the treated group as evident by the significant of the ATE and ATET coefficients for all the estimation methods at 10% probability for between and within, respectively. Thus, the impact of the programme made the productivity of the treated group to be higher by 988.17kg than that of the pool (non-treated) group.
Generally, it can be inferred that participation in the programme made the yield of the participating farmers to be higher and different from that of the non-treated groups; while participation intensity results in higher and differed yield level within the treated group. Thus, the programmee has improved the rice food security of the participating farmers.
Yield Differential between the Treated Group and Non-Treated Groups
Shown in Table 8 are the individual variables absolute contributions to the total yield differentials between the treated group and non-treated groups viz. control, spill-over and the pooled (non-treated).
For the treated group versus the control group, it was observed that resource endowment factors viz. NPK fertilizer, urea fertilizer, herbicides and farm size contribute favourably to the yield level of the treated group; while seed, family labour, hired labour and depreciation on capital items favoured the yield level of the control group. Furthermore, the contribution of the productive resources toward the yield differential between the two groups arose due to the differences in the parameter estimates of the predictor variables. The structural factors viz. seed, NPK fertilizer, urea and family labour favoured the production level of the treatment group; while herbicides, hired labour, depreciation on capital items and farm size favoured the yield level of the control group.
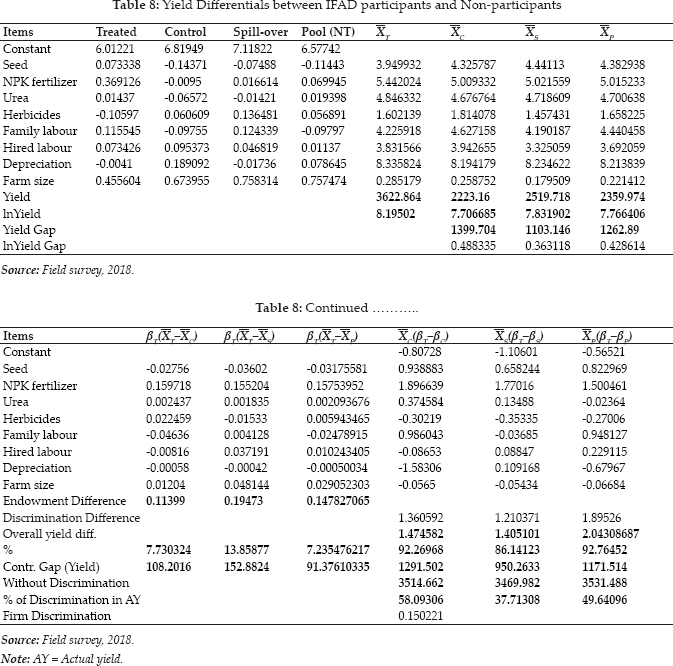
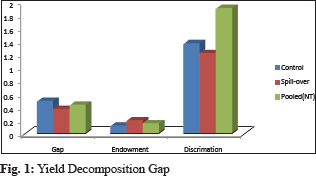
A cursory review of the results showed that 92.27% of the yield differential between the treated group and the control group was largely due to structural effect called programme participation; while the endowment effect viz. resources accounted for 7.73%. With an average yield of 3622.86kg and 2223.16kg for the treated and control groups respectively, the yield gap is 1399.70kg. Of the yield gap viz. 1399.70kg, the difference due to the superior resource endowment of the treated group accounted for 108.20kg; while the difference due to the participation in the programme accounted for 1291.50kg. This implies that due to the structural difference, the control group lost 1291.50kg per hectare. The value of the discrimination represents 58.09% of the average actual yield of the control group. Given the inputs at the disposable of the control group, the result showed that without the structural difference their average actual yield should be 3514.66kg. The results showed the estimated yield gap to be 48.83% (i.e. lnT - lnC = 0.4883), the resource endowment effect was 11.39% [i.e. (T - C)  T = 0.1139] and the discrimination effect was 136.06% [i.e. (T - C)XC = 1.3606](Fig. 1).
For the treated group versus the spill-over group, the resource endowment factors viz. NPK fertilizer, urea fertilizer, family labour, hired labour and farm size favoured the output level of the treated group; while seed, herbicides and farm size favoured the output level of the spill-over group. However, the contribution of the inputs toward the yield gap between the two groups is largely due to the differences in the coefficients of the controlled variables. The empirical evidences showed structural factors viz. seed, NPK fertilizer, urea fertilizer, hired labour and depreciation on capital items favoured the yield level of the treated group; while herbicides, family labour and farm size favoured the yield level of the spill-over group.
Furthermore, it was observed that structural difference viz. participation in the programme was responsible for 86.14% yield differential between the two groups while 13.86% is attributed to endowment difference viz. inputs. For average productivities of 3622.86kg and 2519.72kg for the treated group and spill-over group respectively, their productivity gap is 1103.15kg. Of the total yield gap of 1103.15kg, the superior resource endowment of the treated group accounted for 152.88kg while participation in the programme accounted for 950.26kg. Thus, this implies that due to non-participation in the programme by the spill-over group, they lost 950.26kg of rice output. The discrimination effect represents 37.71% of the average actual yield of the spill-over group. Thus, in the absence of structural difference, the yield of the spill-over group should be 3469.98kg. The yield gap was observed to be 36.31% (i.e. lnT-lnS = 0.3631), the resource endowment effect was 19.47% [i.e. (T - S) T = 0.1947] and the structural effect was 121.04% [i.e. (T - S)s = 1.2104] (Fig. 1).
Between the treated group and the pool (non-treated) group, NPK fertilizer, urea fertilizer, herbicides, hired labour and farm size were the endowed resources that contributed favourably to the yield of the treated group; while seed, family labour and depreciation on capital items were the resource endowments that contributed favourably to the yield of the pooled group. Furthermore, the contribution of the inputs used towards the yield differential was majorly due to the differences in the coefficients of the independent variables. Thus, structural difference due to seed, NPK fertilizer, family labour and hired labour favoured the yield of the treated group; while urea fertilizer, herbicides, depreciation on capital items and farm size favoured the yield of the pool non-treated group.
It was observed that 92.77% of the yield differential was due to structural difference while the resource endowment accounted for 7.24%. Given an average yield of 3622.86kg and 2359.97kg for the treated and pooled (non-treated) groups respectively, the resultant yield gap is 1262.89kg. Out of the 1262.89kg, 1171.51kg and 91.38kg owed to programme participation and superior resource endowment respectively, of the treated group. Therefore, it means that the pooled (non-treated) group lost 1171.51kg of rice output due to non-participation in the programme. The structural effect accounts for 49.64% of the average actual productivity of the pooled (non-treated) group. However, without structural difference, the yield of the pooled (non-treated) group should be 3531.48kg. The results showed the yield gap to be 42.86% (i.e. lnT-lnp = 0.4286), the resource endowment effect was 14.78% [i.e. T-P) T= 0.1478] and the structural effect was 189.53% [i.e. (T - P)P = 1.8953 (Fig. 1).
Generally, it can be inferred that the overall gap in the yield level between the treated group and untreated groups is attributed to participation in the programme i.e. structural difference. In addition, the yield gap that can be explained by differences in the covariates vis-à-vis the treated versus untreated groups were positive, meaning the non-treated groups have less characteristics associated with higher productivity. Furthermore, with the difference of the unexplained gaps between control and spill-over groups being 0.15, it can be inferred that the control group suffered from only non-participation discrimination, while the spill-over group suffered from both firm and non-participation discriminations. The positive difference-in-difference estimate conforms to the a priori expectation.
CONCLUSION AND RECOMMENDATIONS
Based on the empirical evidence, it can be inferred that the technical unit of the treated group is more efficient owing to low break-even price i.e. cost of production and high break-even yield. Thus, the participating farmers are efficient in managing their enterprise risk. Furthermore, both in the short-run and long-run, the programme had effect on the yield of the participating farmers. In addition, disparity in the yield of the treated group been higher than that of the non-treated groups, majorly owed to the structural difference called participation in the programme. Therefore, the following recommendations were made:
For risk management strategy; the participating farmers should increase their insurance coverage and adjust their production plan so as to increase their chances of breaking even in rice production.
This programme should be extended to the non-participating areas in order to maximize their potentials, thus enhancing the livelihood and rice food and nutrition securities of the farming households in particular, and that of the rural, state and national economies in general.
REFERENCES
Abdullahi, A.J., Atala, T.K., Akpoko, J.G. and Sanni S.A. 2015. Factors influencing smallholder farmers participation in IFAD-Community Based Agricultural and Rural Development Project in Katsina State. Journal of Agricultural Extension, 19(2): 93–105.
Amaefula, C., Okezie, C.A. and Mejeha, R. 2012. Risk attitude and insurance: A causal analysis. American Journal of Economics, 2(3): 26–32.
Andrea, B. 2014. Linking Smallholder farmers to markets and the implication for extension and advisory services. MEAS Discussion Paper No. 4. United State Agency for International Development.
Atala, T.K. and Hassan, M.B. 2012. Adopted village concept and vision 20: 2020. Paper presented at the North West Zonal REFILS Workshop, held at the Institute for Agricultural Research, Ahmadu Bello University, Zaria, pp. 23–24.
Babatunde, O. 2006. Differential poverty reduction impact of small-scale irrigated development between its beneficiaries and non- beneficiaries in Nigeria. Technical Report on the Agropolis Award.
Blinder, A.S. 1973. Wage discrimination: reduced form and structural estimates. Journal of Human Resources, 8(4): 436–455.
International Fund for Agricultural Development (IFAD) (2013). COSOP Mid Term Review Operations. Ifad.org/web/ifad/operations/country/home/tags/Nigeria-02/02/2015; 5:11
Lokshin, M. and Sajaia, Z. 2011. Impact of interventions on discrete outcomes: Maximum likelihood estimation of the binary choice models with binary endogenous regressors. The Stata Journal, 11(3): 11–21.
Marwa, B. 2014. Estimation of gender wage differentials in Egypt using Oaxaca Decomposition technique. Paper presented at the 34th annual MEEA meeting in conjunction with the Allied Social Science Association (ASSA), Philadelphia,
Oaxaca, R. 1973. Male-female wage differentials in urban labor markets. International Economic Review, 9: 693–709.
Onyenweaku, C.E. 1997. Impact of technological change on output, income, employment and factor shares in rice production in Southeastern Nigeria. Issues in African Rural Development Monograph Series, Monograph #5, African Rural Social Sciences Research Networks, Winrock International.
Revathy, N., Thilagavathi, M. and Surendran, A. 2020. A comparative analysis of rural-urban migrants and non-migrants in the selected region of Tamil Nadu, India. Economic Affairs, 65(1): 23–30.
Schubert, R. 1994. Poverty in developing countries, its definition, extent and implications. Economics, pp. 49/50.
Wang, A., Nianogo, R.A. and Arah, O.A. 2017. G-computation of average treatment effects on the treated and the untreated. BMC Medical Research Methodology, 17(3): 1–5.