Economic Affairs, Vol. 65, No. 4, pp. 603-609, December 2020
DOI: 10.46852/0424-2513.4.2020.16
![]()
Review Paper
Impact of Trade Liberalisation Policies on the Coconut Export from India
ABSTRACT
The present study analysed the impact of trade policies on coconut economy of Kerala based on the secondary data from Coconut Development Board (CDB) and Export-Import data bank of Government of India. Exponential growth function, Cuddy- Della instability index and Revealed Symmetric Comparative Advantage (RSCA) were used to compute the growth rates, instability indices and comparative advantage, respectively. Though trade liberalization adversely affected the coconut farmers during the initial phase of liberalization, it subsequently increased the opportunities of the Indian coconut sector to compete in the world market. Compared to Period I (1980-81 to 1993–94), a significant improvement in the coconut export was observed during Period II (1994-95 to 2007–08) and Period III (2008-09 to 2016–17). The high growth rates of coconut products together with low instability indices in the export revealed the prospects for Indian coconut sector in the global market during the post liberalization period. The value of RSCA revealed that India lacked any comparative advantage of coconut export in Period I. While in Period II, the export of coconut and copra possessed a comparative advantage from 2002 and 2005, respectively, and maintained the comparative advantage throughout the Period III. The result indicated that India must give much effort to increase the export share of coconut, copra and other value-added coconut products to augment the foreign earnings.
Highlights
 A significant improvement in the coconut export was observed during post liberalization period.
India lacked any comparative advantage of coconut export during the pre liberalization period.
Coconut and copra export possessed comparative advantage during the post liberalization period.
Keywords: Export, Import, Compound Growth Rate (CGR), Instability index, Revealed Comparative Symmetric Advantage (RCSA)
Coconut (Cocos nucifera L.) is a crop of economic significance grown in more than 90 countries of the world. Most of the world production is in tropical Asia, with India, Indonesia and the Philippines collectively accounting for over 70 percentage of the total production. India stands first in world coconut production and productivity, contributing 23798.23 million nuts from an area of 2.09 million ha with remarkable productivity of 11,350 nuts hectare-1 (CDB, 2018). India contributes 17 percentage to the global coconut area and 31 percentage to global coconut production.
The coconut industry in the country was enjoying the privileges of a closed economy until 1995, and significant and sustainable growth in production and productivity was observed during the protected regime. Consequent to India became a signatory to the World Trade Organization (WTO), the domestic coconut market was exposed to international players. The globalization had posed multiple challenges to the future of Indian coconut industry. Indian coconut industry encountered major threats and challenges concomitant to trade liberalisation in the form of import substitution with low price products of similar nature (Rethinam and Idroes, 2005).
How to cite this article: Thasnimol, F., Prema, A. and Jayasekhar, S. (2020). Impact of Trade Liberalisation Policies on the Coconut Export from India. Economic Affairs, 65(4): 603–609.
Source of Support: None; Conflict of Interest: None ![]()
The opening of the domestic market for the world players and the global integration of the national markets witnessed a paradigm shift in the domestic coconut economy. The price of coconut oil became uncompetitive due to increased trade openness and the domestic coconut industry lost the premier role played in the pre-liberalisation period (Samarajeewa et al. 2002). Frequent reduction of tariffs in the early liberalisation period furnished a provision of increased domestic access to other countries. Besides being signatory to WTO, the FTAs with neighbouring countries in South Asia and South East Asia also had increased the imports of cheap coconut oil substitutes like palm oil and palm kernel oil. The high cost of domestic production favoured the cheap imports of coconut and coconut products from other major producing countries and this, in turn, created concern and anxiety among the domestic farmers (Ghosh, 2009; Mathew and Baby, 2011). However, later trade liberalization policies brought prospects to Indian agriculture through the export of coconut and its products. With the above backdrop, the present study aims to assess the impact of liberalization policies on the performance of coconut trade from India.
METHODOLOGY
The impact of liberalization policies was studied by estimating the export growth rate, export instability and comparative advantage of various coconut products. The import and export data of coconut products, both in quantity and value terms were collected from Coconut Development Board (CDB) under the Ministry of Agriculture, Government of India and Export- Import data bank (Government of India). Exponential growth rates were worked out to compare the export of different coconut products from India. For getting a clear picture, the entire study period, i.e., from 1980–81 to 2016–17 was divided into three periods. The Period I starts from 1980–81 to 1993–94, the pre-liberalisation period characterized by the minimum import of edible oil. The Period II starts from 1994–95 to 2007–08, frequent changes in the tariff structure observed during this period and reduction in the import tariff favoured huge import of palm oil and other substitute oils into the Indian markets. Period III starts from 200809 to 2016–17, a significant change in the export of coconut and coconut products observed during this period and the trade balance of coconut found to become positive throughout the period.
The growth rate was worked out using the exponential growth function of the form
Yt = abt cu
Where,
Yt = Dependent variable for which growth rate is to be estimated; a = Intercept; b = Regression coefficient; t = Time variable; u = Error term
The exponential growth rate was worked out by transforming the equation to the log linear form as
Ln Yt = In a + t In b + u
The method of ordinary least square was adopted to estimate the coefficient (b's). The compound growth rate in percentage (G) was calculated using the relationship
G = {(Antilog of b)-1} × 100
The significance of the growth rates was tested using the student's t- test statistic
In order to study the variability in the export of different coconut products, the formula suggested by Cuddy and Valle (1978) was used.

RSCA measures the comparative advantage or disadvantage of a country to another country or group of countries. The value of RSCA ranges from -1 to +1. Positive RSCA value indicates the comparative advantage of the country in export of the commodity and vice versa. RSCA index is calculated using the formula,
Where,
RCAij = (Xij/Xwj) / (Xi/Xw)
Xij = ith countray's export of a commodity j in value terms; Xwj = World export of commodity j in value terms; Xi = Total export of country i in value terms; Xw = Total world exports in value terms
RESULTS AND DISCUSSION
Export Growth of Coconut Products
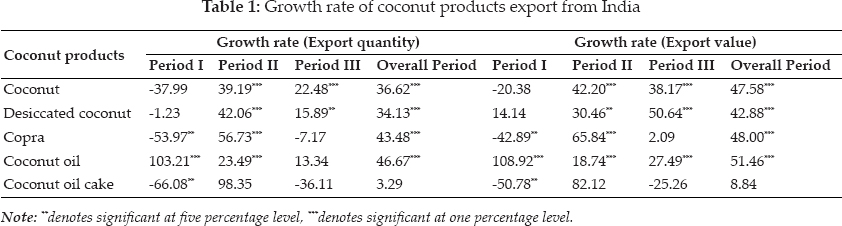
The compound growth rate of different coconut products from 1980–81 to 2016–17 is presented in Table 1. In Period I (1980-81 to 1993–94), except coconut oil, all other coconut products exhibited negative growth rates. Coconut oil exhibited a significant positive growth rate of 103.21 percentage in terms of quantity and 108.92 percentage in terms of value. The high growth rate of coconut oil does not imply that the coconut oil export during the 1980s was remarkable and high, but it was solely due to the fact that the increase in coconut oil export was from a negligible quantity of 0.237 tonnes in 1980–81 to 318.07 tonnes in 1993–94. In the case of copra, the export showed a significant and negative growth rate of 53.97 and 42.89 respectively, both in terms of quantity and value.
Seeds of liberalisation prospered during Period II (1994-95 to 2007–08) and the coconut industry looked hopefully towards the global market and improved its share in the international market through enhanced trade. Among the traditionally traded coconut products, copra fetched the highest significant growth rate of 56.73 percentage in terms of quantity and 65.84 percentage in terms of value. During 1994–95, the export of copra from India was very low and was about 10 tonnes, but the demand of copra from the global market increased steadily from 2004–05, and the quantity exported from India reached about 1617.46 tonnes in 200708. Export of copra amazingly increased during 2008–09 and touched 13578 tonnes and the export earnings reached about ₹ 5,580.70 lakh. Initially, the domestic price of copra was higher than that of international prices and copra export was found to be very meager during this period. Due to the adverse climatic conditions in major coconut producing countries, the global market faced with the shortage of the products during the 2008–09 periods, and the limited availability of the product coupled with increased global demand raised the international price of coconut and copra (GOI, 2011). Besides, the huge import of palm oil, the closest and cheap substitute of coconut oil started influencing the price of coconut oil. At the same time, the demand for Indian copra increased in the global market, and Indian dealers exported more copra to the global market in order to reap the benefit from international prices (Thasnimol and Prema, 2017). Apart from copra, other products such as desiccated coconut, coconut (fresh and dried) and coconut oil also had shown positive and significant growth rates of 42.06, 39.19 and 23.49 percentage respectively, in terms of quantity and 30.46, 42.20 and 18.74 respectively, in terms of value. Despite the high growth rates, the export share of coconut and its value added products constituted less than 10 percentage of the total world exports (Sebastian, 2015).
In Period III (2008-09 to 2016–17), significant export growth rates were observed only for coconut and desiccated coconut. However, the computed growth rates were found to be lower than that in the second period. The growth rates of coconut and desiccated coconut were 22.48 and 15.89 percentage respectively, in terms of quantity, and in value terms, the growth rates were 38.17 and 50.64 percentage respectively. Even if the growth rates were comparatively lower than that of the second period, the quantum of export and export earnings of coconut products increased substantially during this period. The export of coconut (fresh and dried) increased from 16608.6 tonnes in 2008–09 to 111255.8 tonnes in 2016–17. Similarly, the export of desiccated coconut increased from 2173.29 tonnes to 14563.26 tonnes. In 2009, the Government of India designated the Coconut Development Board (CDB) as the Export Promotion Council (EPC) for coconut and coconut products except coir and coir products. The action helped the Board to pay more attention to the export promotion activities, and as a result, the export of coconut products has been registering significant growth since 2009–10. Jayasekhar et al. (2019) also had opined in similar line that India was a small player in the export market of coconut products during the 1980s and 1990s. However, India's export sector has become vibrant with a very high growth rate of coconut products since the upgradation of Coconut Development Board (CDB) to the status of Export Promotion Council (EPC). Even though the growth rate of coconut oil in terms of quantity was positive, it was not found to be significant, while the growth rate in value terms showed a significant value of 27.49 percentage. This increased growth rate in value terms owed to the hike in international coconut oil price, and the price had increased from US$ 1,285 tonne-1 in January 2008 to US$ 1,699 tonne-1 in December 2016. Nevertheless, India could not gain much headway in coconut oil exports as the domestic price of coconut oil ruled above the international price till February 2016 (Singh, 2016). Apart from that, the increased domestic demand and the increased availability of low priced substitute oils affected the export of coconut oil from India (Vasanthkumar et al. 2015). The export growth rate of copra was found to be negative registering a value of -7.17 during the period, which could be attributed to the rapid and huge reduction of copra export from 2014 to 2016. However, the quantity of copra export increased from 13578 tonnes in 2008–09 to 18227 tonnes in 2016–17.
Period I- 1980–81 to 1993–94 , Period II- 1994–95 to 2007-08, Period III- 2008–09 to 2016–17 and Overall Period -1980-81 to 2016–17.
Export Instability of Coconut Products
The instability indices are used by policymakers to formulate appropriate export promotion and investment policies. A high instability index value discourages investment in the production and the export of the commodity. The estimated instability indices in the export of different coconut products are reported in Table 2. It can be observed from the table that except coconut oil cake, all other coconut products registered highest instability indices during Period I than the other two periods. In Period I, the maximum instability index in export quantity was observed in the case of coconut oil (176.20) followed by copra (172.89), coconut oil cake (141.50), coconut (115.45) and desiccated coconut (109.01). This indicated that coconut oil export from India was less stable compared to other products. It is interesting to note that the instability index of the export quantity of coconut (fresh and dried) declined to 38.98 in Period II and it further decelerated to 19.33 in Period III. The instability indices of desiccated coconut and copra were found to decrease over entire period. In desiccated coconut, the instability index has declined from 109.01 in the Period I to 80.16 in Period II and it further dropped to 63.72 in Period III. Similarly, in copra, the instability index declined from 172.89 in Period I to 90.96 in Period II and further to 33.28 in Period III. It is rather paradoxical to note that the instability index of the coconut oil decreased substantially in Period II (27.71), but the index was found to have increased in Period III (79.92). Even though the coconut oil export was very less during the 1980s, the large fluctuations in the export exhibited during the period led to the high instability index of coconut oil. During Period II, a gradual increase in the export of coconut oil was noticed and the export increased from 541.95 tonnes in 1994–95 to 6816.89 tonnes in 2007–08. Even though slight fluctuations were observed, relatively stable growth of export observed during the period has resulted in the low value of instability index of coconut oil. Compared to the Period II, a large fluctuation in the coconut oil export was noticed during the Period III. A restriction in trade practice whereby the export of coconut oil was permitted only in consumer pack of five kilogram until June 2013. After that, the restriction was withdrawn by the government and as a result, coconut oil export had progressed from 2014–15 (Jnanadevan, 2017) and this attributed to the high fluctuation and instability of coconut oil export during the period. Despite this fact, the export quantity of coconut oil increased substantially from 9854.58 tonnes in 2008–09 to 33499.49 tonnes in 2016–17. Unlike other coconut products, coconut oil cake showed highest instability index in Period II (220.68) and the instability index values in the Period I and Period III are 141.50 and 145.72 respectively.
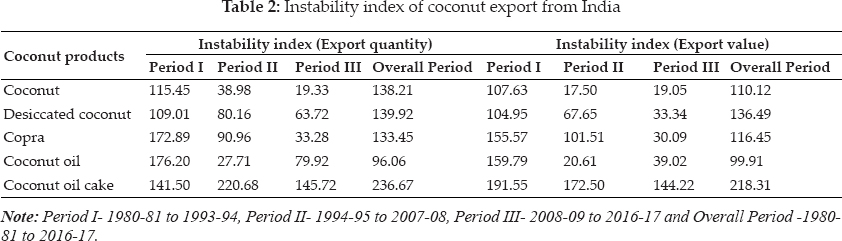
The low instability of coconut export observed in Period III was mainly due to the effort made by the Coconut Development Board. The interventions of CDB as Export Promotion Council (EPC) had contributed to the high stability of coconut export during the Period III which is very well reflected in the attractive export growth rate during the regime and thereafter (Thasnimol and Prema, 2017). In a nut shell, the analysis revealed that the instability in coconut product export has decreased during the post-liberalisation and the government measures during the post-liberalisation regime have favoured the export sector of coconut.
Comparative Advantage of Coconut Export from India
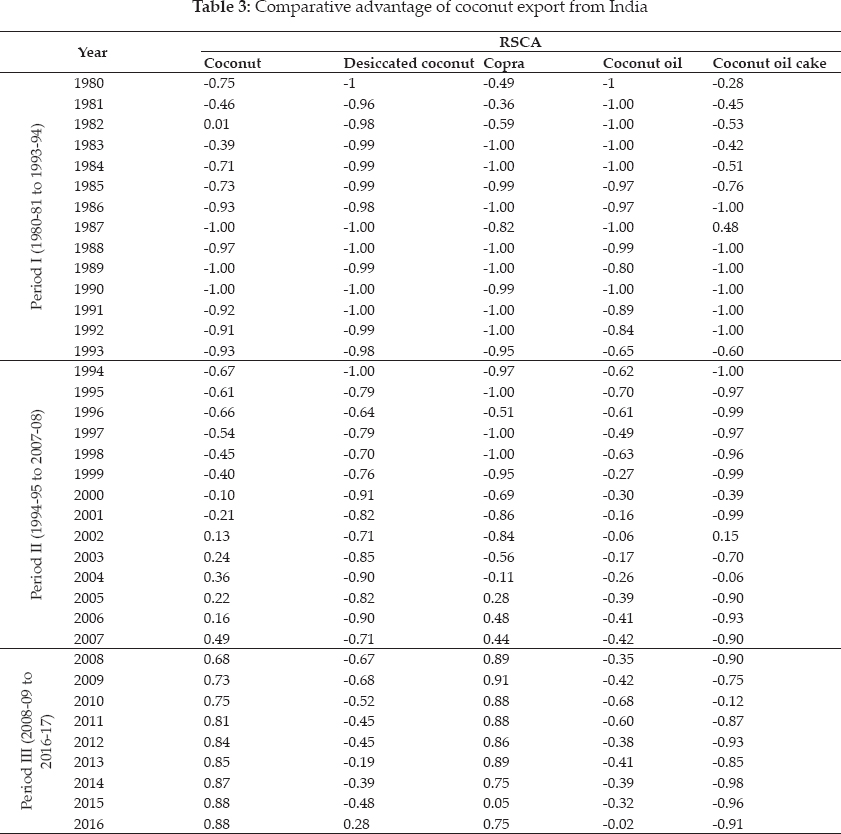
Revealed Symmetric Comparative Advantage (RSCA) measures the comparative advantage or disadvantage of a country with respect to another country or group of countries for a specific commodity. The value of RSCA ranges from -1 to +1. A positive RSCA value indicates the comparative advantage the country holds in the export of the particular commodity. Table 3 shows that the RSCA values of all coconut products are negative throughout Period I. In Period II, the RSCA of all coconut products continued as negative until 2001 and in 2002 RSCA of coconut (fresh and dried) became positive and thereafter gradually increased over the subsequent years reaching 0.49 at the end of Period II. The gradual improvement in the RSCA value signifies the comparative advantage of India in coconut trade. In the case of copra, the RSCA value was found to become positive from 2005 onwards, and at the end of Period II, the value stood around 0.44. The result depicted that compared to other competing countries the copra export from India exhibited a comparative advantage since 2005. In all other coconut products, RSCA value was found to be negative throughout the Period II.
A substantial improvement in the RSCA value of coconut products, especially coconut (fresh and dried) and copra could be observed during the Period III. A progressive improvement in the value of RSCA was observed in coconut, which increased from 0.68 in 2008 to 0.88 in 2016. In copra, a large increase in the export was recorded during the 200708 period, and thereby RSCA improved remarkably from 0.44 in 2007 to 0.89 in 2008. The RSCA value more or less remained stable during the subsequent years. But in 2015, RSCA value sharply declined to 0.05 due to the scanty export of copra from India due to the cheaper availability of copra from our competitors. Later in 2016, India could regain its substantial share in copra export and is reflected in the RSCA value (0.75).
The period wise analysis of the comparative advantage of India on the traditional coconut products expressed in terms of RSCA indicated that India possessed comparative advantage for coconut (fresh and dried) and copra alone. The RSCA value of desiccated coconut, coconut oil, and the coconut oil cake was found to be negative throughout the period which depicted that India does not possess any comparative advantage over the other competing countries in the export of these items, given the present level of value addition and processing facilities in the country.
CONCLUSION
As an outcome of liberalization, India extended trade ties with other countries and significant improvements in the coconut export was observed during the post-liberalisation regimes, i.e., Period II and Period III. Except coconut oil, the export of all other coconut products exhibited negative growth rate during the Period I and a tremendous spurt in export was observed during the Period II and Period III. Along with the high export growth rates, a progressive decrease in the instability indices of export indicated the stability of coconut export market. The value of Revealed Symmetric Comparative Advantage (RSCA) revealed that India lacked comparative advantage in coconut export during Period I. While in Period II, the export of coconut and copra showed a comparative advantage from 2002 and 2005, respectively and maintained comparative advantage throughout in Period III. While desiccated coconut and coconut oil did not hold a comparative advantage in trade in any of the selected period .
In view of the above findings, the following implications have been drawn from the study:
◆ Even though India's share in world coconut export was very less, the high growth rates of coconut products experienced during Period II and Period III together with low instability indices in the export revealed the prospects for Indian coconut sector in the global market. So, the finest arrangement should be taken to streamline the production to meet the export requirement also.
◆ The study reveals that coconut oil and desiccated coconut did not possess any comparative advantage in global trade, while coconut (fresh and dried) and copra has comparative advantage. Hence, to enhance the export earnings through the trade, it is imperative to concentrate on the trade of those commodities that have a comparative advantage in export.
ACKNOWLEDGEMENTS
I am thankful to Kerala Agricultural University for the technical and financial assistance for pursuing my study and research work and sincerely acknowledge University Grant Commission for providing me the Moulana Azad National Fellowship during the entire course period.
REFERENCES
CDB. 2018. CDB home page [online]. http://www.coconutboard.nic.in.
Cuddy, J.D.A. and Valle, P.A.D. 1978. Measuring the instability of time series data. Oxford Bull. Econ. Statist., 40: 53–78.
Ghosh, N. 2009. Effects of tariff liberalization on oilseed and edible oil sector in India: Who wins and who loses? Working Paper No. 2, Takshashila Academia of Economic Research Limited, Andheri (East), Mumbai, India, pp. 45.
GOI. 2011. Price policy for copra the 2012 season. Commission for Agricultural Costs and Prices, Dept. of Agriculture and Cooperation, Ministry of Agriculture, pp 77.
Jayasekhar, S., Chandran, K.P., Thamban, C. and Muralidharan, K. 2019. Coconut sector in India experiencing a new regime of trade and policy environment: A critical analysis. J. Plant. Crops, 47(1): 48–54.
Jnanadevan, R. 2017. Copra and coconut oil - The production trend in India. Indian Coconut J., 59(10): 10–12.
Mathew, T. M. and Baby, P.O. 2011. Global competitiveness of Indian coconut oil-an outlook. Indian Coconut J., 51(6): 5–13.
Rethinam, P. and Idroes, S. 2005. Coconut: Steps for yield increase. The Hindu Survey of Indian Agriculture. In: Ram, N. (Ed.), Kasthuri and Sons Ltd., Chennai, India, pp.89-92.
Samarajeewa, S.R., Weeraheewa, J. and Gunatilake, H.M. 2002. Tariff policy liberalisation in edible oil market and its implications on the coconut producers in Sri Lanka. Trop. Agric. Res., 14: 317–326.
Sebastian, K.S. 2015. Indian coconut exports scaling new heights. Indian Coconut J., 58(6): 6–9.
Singh, A. K. 2016. Coconut development in India- The status. Indian Coconut J., 59(6): 5–10.
Thasnimol, F. and Prema, A. 2017. Performance and competitiveness of coconut trade in India. Trends Biosci. 10(22): 4495–4499.
Vasanthkumar, V.C., Viswam, R.P., Vijayan, R. and Thomas, G. 2015. Coconut oil market- an insight and the way forward. Indian Coconut J., 58(2): 6–9.