Economic Affairs, Vol. 65, No. 4, pp. 611-617, December 2020
DOI: 10.46852/0424-2513.4.2020.17
![]()
Research Paper
Assessment of the Food Security Status of Households Belonging to different Regions of Himalayan Belt
ABSTRACT
India has not only achieved self-sufficiency in food production but also enhanced its ability to deal with inter year fluctuations in production. Despite the much commended economic growth of the country, the average calorie consumption in India has declined over the years and has been low in comparison to international standards. Hilly states in particular, confront multiple food insecurity risks owing to many reasons like dominance of traditional agriculture, low yields of food and cash crops, and lack of market incentives, etc. Three northern hilly states namely; Jammu and Kashmir, Himachal Pradesh and Uttarakhand constitute the Himalayan belt of India. Out of the three hilly states Uttarakhand was purposively selected for the study due to higher below poverty line (BPL) percentage (RBI, 2012) and the higher rank (6th rank) in the development disability index (NIPFP report, 2013) than the other two states. The present study assessed the existing food security status of the state over the National Sample Survey Organization (NSSO) rounds and measured inequality in calorie intake across various income groups. The study utilized unit record data on household consumption expenditure surveys extracted from CDs for two rounds viz., 61st round (2004-05) & 68th round (2011-12) conducted by NSSO. The state was first categorized into two regions viz., hill and plain region. Households in either region were further classified into different quartiles on the basis of their monthly per consumer unit expenditure and across these quartiles the information was obtained. To assess the incidence, depth and severity of food insecurity Foster, Greer and Thorbecke-FGT (1984) class of poverty measures was used Inequality in calorie intake among different expenditure class was calculated through Gini coefficient. Results revealed that despite a noticeable decline in the share of food expenditure till 68th round it was still more than 50% among people of lower income group (LIG) in plains and LIG and lower middle income group (LMIG) in hills. At an overall level hilly region fared well in terms of calorie intake than plain region of the state in each round. The head count index of food insecurity showed that the incidence of food insecurity in plains came down to 52% in 68th round from 61% of 61st round and 39% from 46% in hills during the same period. A considerable difference in dietary pattern when viewed in terms milk and milk products consumption, edible oils, fruits, vegetables and sugars was observed across income groups. The head count index of food insecurity in 61st round showed that 61% households in Plains and 46% households in hills were food insecure, this incidence of food insecurity came down to 52% in plains and 39% in hill region till 68th round. Inequality in plain region was lower in each round, when compared to that in hilly region. A targeted monitoring to ensure food availability through PDS to lower income population can be done and range of food products can be increased for this particular target group.
Highlights
 A considerable difference was observed in dietary pattern when viewed in terms milk and milk products consumption, edible oils, fruits, vegetables and sugars across income groups.
Contrast to the general supposition, hilly regions fared better than the plain regions in terms of calorie intake.
Keywords: Food security, NSSO, Income Quartiles, Calorie intake, Food security index
How to cite this article: Kharkwal, S. and Malhotra, R. (2020). Assessment of the Food Security Status of Households Belonging to different Regions of Himalayan Belt. Economic Affairs, 65(4): 611–617.
Source of Support: None; Conflict of Interest: None ![]()
The onset of the 2008–2009 global economic crisis and food price spikes slowed down the progress towards the Millennium Development Goals (MDGs), 2000 in general and hunger eradication in particular (UN, 2010; Hossain and Green, 2012). The success stories of food security in India posit that the country has not only achieved self-sufficiency in food production but also enhanced its capacity to cope with inter year fluctuations in production. Its food grain production has quadrupled to near 257 million ton and milk production has trebled to 138 million ton over last three decades, yet 260 million people in the country do not have economic access to a consumption basket, which defines the poverty line. The average calorie consumption in India is already low in comparison to international standards and has declined despite the much acclaimed economic growth of the country. Country's 55th rank among 117 countries in Global Hunger Index (GHI) 2015 reflects serious levels of food insecurity.
The problem of transitory food insecurity is associated with issues related to either access or availability of food whereas chronic food insecurity is often argued to be due to the lack of purchasing power leading inadequate diets among large masses of rural population (Radhakrishna, 2002). Though India's achievement in combating transitory food insecurity is commendable, the issue of chronic food insecurity still persists in the country.
Hilly states in particular, confront multiple food insecurity risks owing to many reasons like undulated topography, dominance of traditional agriculture, which results in the low yields of food and cash crops, less precipitation, low use of modern inputs and lack of market incentives, soil erosion (a high rate of 46.0 t/ha, top soil and micronutrients wash away annually) etc. These are the critical pull factors of agrarian economy and the household food security (Barah, 2010).
In this backdrop, present study was conducted to assess the existing state of food security in the Himalayan region. The inequality in food and energy intake across various income groups has also been verified in the paper.
Methodology and Data
Three major northern hilly states namely; Jammu and Kashmir, Himanchal Pradesh and Uttarakhand constitute the Himalayan belt of India. Out of these states Uttarakhand was purposively selected for the study due to following reasons:
◆ Uttarakhand had higher rural (11.62 per cent) and urban (10.48 per cent) below poverty line (BPL) percentage (RBI, 2012).
◆ The state performed worse (6th rank) than Himanchal Pradesh (8th rank) and Jammu and Kashmir (10th rank) in the development disability index (NIPFP report, 2013).
Uttarakhand state comprises of nine hilly (Uttarakashi, Chamoli, Rudraprayag, Tehri Garhwal, Pauri Garhwal, Pithoragarh, Champawat, Bageshwer and Almora) and four plain districts (Dehradun, Haridwar, Nainital, and Udham Singh Nagar) with higher population density in plain region. Hence, the present study identified these two hill and plain regions to assess the status of food security in the state.
The Database
The study utilized unit record data on household consumption expenditure surveys conducted by the National Sample Survey Organization (NSSO). However, instead of culling information from the published NSSO reports, the unit level data were extracted from the CD of NSSO. The NSSO conducts nationwide household consumer expenditure surveys (CES) at regular intervals in “rounds”, each of which is normally of a five year's duration. These surveys are conducted through interviews of randomly selected representative samples by a scientific method. Among other major uses of the CES, the food consumption data (quantity) are used to study the level of nutrition. The information is collected under different schedules with various parameters. The present study used the data collected on “Schedule Type 1.0”, which includes information on all food, fuel and consumer services over a period of 30-days. For certain a category of infrequently purchased items like, clothing and consumer durables, data is collected for the last 30 days and the last 365 days. The dataset used in the present study is part of the 61st round (2004-05) & 68th round (2011-12).
Households in both the rounds were first divided into four income groups each in plain and hills region, giving sixteen groups in all. As data on
Assessment of the Food Security Status of Households Belonging to different Regions of Himalayan Belt income were not available, expenditure data were taken as a proxy for income. The divisions were made by dividing households on the basis of their Monthly per Consumer-unit Expenditure (MPCE), giving four quartiles named as follows: Lower Income Group (LIG), Lower-Middle Income group (LMIG), Upper-Middle Income Group (UMIG), and Higher Income Group (HIG), corresponding to the 1st quartile, 2nd quartile, 3rd quartile, and 4th quartile, respectively. By dividing the sample thus, the heterogeneity in calorie intake can be taken into consideration. Across these groups the following information was obtained.
◆ Average share of food expenditure in total expenditure.
◆ Average calorie intake per consumer unit.
◆ Percentage break-up of calorie intake by food groups.
◆ Inequality in calorie intake among different expenditure class.
Food consumption was converted into nutrient equivalents for calories using the conversion tables given by Gopalan et al. (1991).
Further to see the incidence and depth of food insecurity Foster, Greer and Thorbecke-FGT (1984) class of poverty measures were adopted. The formula is as follows;
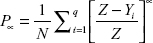
where,
Z = Threshold level of calorie requirement per day per consumer unit (2700 kcal/day/CU)
Q = Number of food insecure households,
N = Total number of households in the total population,
Yi = Calorie intake of each household i and
Px = Weighted food security index.
A = The weight attached to the severity of food insecurity, which measures the incidence, depth and severity of food insecurity respectively with the values of 0, 1 and 2.
RESULTS AND DISCUSSION
Distribution of Population in two major regions of the state
An examination of Table 1 shows that the share of hill region in the population of Uttarakhand declined substantially by about seven percentage points from nearly 51 per cent in 61st round to about 44 per cent till 68th round. While a sizeable 55.96 per cent of population was residing in four plain districts of the state in 68th round. Total estimated population of the state increased by 15.04 per cent in seven years.
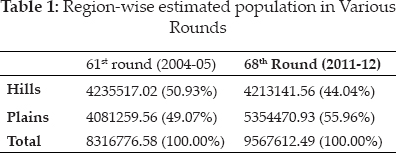
The corresponding census figures reflected much lower growth in population (0.70 per cent) in the hill region of the state as compared to plain region (2.82 per cent) from 2001 to 2011; thus, were in consonance with the NSSO data. Much of this growth in population in plain districts of Uttarakhand was contributed by migration from hill districts (Mamgain and Reddy, 2017). Higher growth rate in plain region implies that plain region of the state was emerging as predominant center of economic activities and was attracting a huge out-migration from the hill regions to plain districts of the state.
Average monthly per consumer unit expenditure across different classes
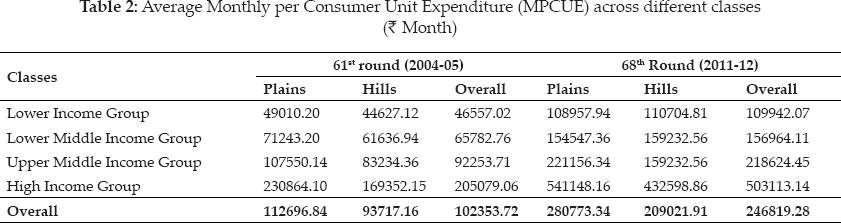
The households were classified into four different income groups on the basis of their average monthly per consumer unit expenditure. Table 2 gives a detail of average monthly per consumer unit expenditure across different classes in 61st and 68th round.
The monthly per consumer unit expenditure was found slightly higher among people belonging to plain region across all income quartiles in each round. Average monthly per consumer unit expenditure of higher income group was almost four times more than that of lower income group in all plains, hills and overall. After adjusting to inflation, the average real consumer unit expenditure increased by 125 per cent in plains, 103 per cent in hills and 119 per cent overall from 61st to 68th round.
Average share of Monthly Food Expenditure in Total Expenditure
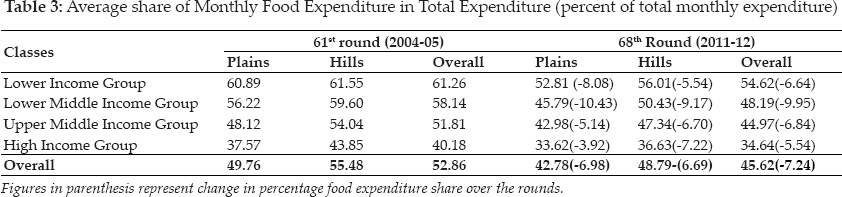
Table 3 identifies average share of monthly food expenditure in total expenditure for four income groups in both NSSO rounds. A close perusal of table shows that in 61st round the share of food expenditure in total expenditure was highest among lower income group (LIG) in both plain and hill regions accounting 60.89 and 61.55 per cent, respectively. This share declined with the increase in income and accounted 56.22, 48.12 and 37.57 per cent among LMIG, UMIG and HIG in plain region and 59.60, 54.04 and 43.85 per cent for LMIG, UMIG and HIG in hilly region.
Table 3 further indicates a noticeable decline in the share of food expenditure till 68th round both in plain and hilly regions but was still more than 50 per cent among people of LIG in plains and LIG and LMIG in hills. The rate of this decline was highest among LMIG in plains (10.43 per cent) followed by LIG (8.08 per cent) and among LMIG in plains (9.17 per cent) followed by HIG (7.22 per cent) and UMIG (6.7 per cent).
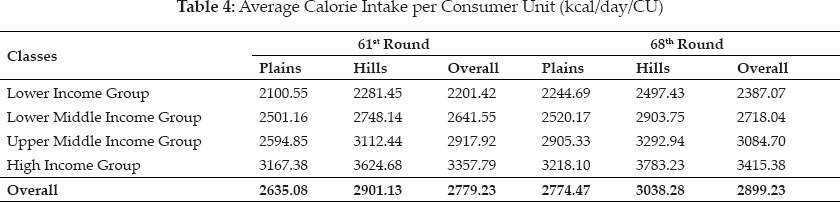
Average calorie intake per consumer unit
Table 4 depicts the average calorie intake per consumer unit across different classes in plain and hills region for both the rounds. Despite having the least share of food expenditure in total expenditure, calorie consumption was highest among high income group. Similar opposite trend of food expenditure was identified in calorie intake among all other income groups in both rounds. Interestingly, hills fared better than plain region in terms of calorie intake in either round. In 61st round for plain region calorie intake of LIG, LMIG, UMIG was below threshold level i.e. 2700kcal/consumer unit/day while in hills only for LIG calorie intake was less than threshold limit. Value of coefficient of variation was 41 per cent and 30 per cent for plains and hill region respectively.
Table further suggests that for all the income groups together calorie intake in plains was still about 2635 Kcal which is below the threshold limit. The reason of this may be people were migrating from hills to plain region in search of jobs yet were not able to find gainful employment and hence, performed poorly in meeting their calorie requirements. Table again reveals that till 68th round all the income groups except LIG and LMIG in plain region and LIG in hills attained the minimum required level of calorie intake. Coefficient of variation for plains was 33 per cent and for hills 35 per cent.
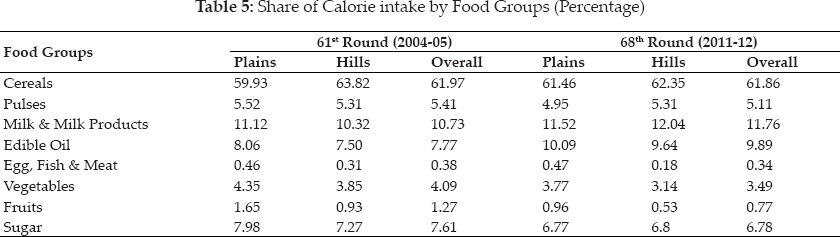
Share of Calorie intake by Food Groups
Table 5 illustrates the percentage break-up of calorie intake by major food groups in 61st and 68th round. Cereals contributed maximum to total calorie consumption, i.e., 61.97 per cent in 61st round and 61.86 per cent in 68th round. This higher consumption of cereals especially in hilly areas are due to the factors other than income and price like higher prices of non food items, higher energy requirements due to manual labor and payment of wages in kind by the large farmers in the form of cooked food, etc.
Milk and milk products were second major source of calorie after cereals and accounted 10.73 per cent and 11.76 per cent of total calorie consumption in 61st and 68th round, respectively. The other important sources of calorie were edible oil, sugar and vegetables in both rounds.
Table 6 and 7 present the food group wise share of calorie intake across different income groups separately for 61st and 68th round. It is evident from the tables that cereals were major source of calorie for different income groups as it contributed more than 50 per cent of total calorie intake in each round. The dietary changes that characterize the “nutrition transition” include both quantitative and qualitative changes in the diet. Income, prices, individual preferences and beliefs, cultural traditions as well as geographical, environmental, social and economic factors all interact in a complex manner to shape the dietary consumption pattern (WHO, 2003).
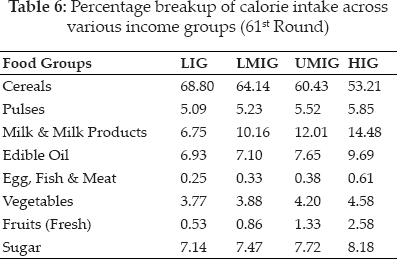
There was a considerable difference in dietary pattern when viewed in terms milk and milk products consumption, edible oils, fruits, vegetables and sugars across income groups. The intake of milk and milk products in total calorie consumption was more than double for HIG than LIG. The share of milk and milk products in total calorie intake was 6.75 per cent, 10.16 per cent, 12.01 per cent and 14.48 per cent for LIG, LMIG, UMIG and HIG.
Similar pattern was found in 68th round, a marginal increase in the milk intake was observed for all income groups. The share of milk and milk products in total calorie intake was 7.63 per cent, 10.68 percent, 14.42 per cent and 15.34 per cent for LIG, LMIG, UMIG and HIG.
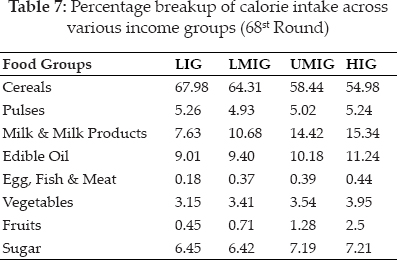
Thus, the effect of increase in income on food consumption can be viewed as substitution of cereals by protective foods like milk, fruits and vegetables depending on income, customs, habits and taste of the people. It implies that improvement in the economic access to food through income augmentation, did not result in a higher consumption of cereals, but had increased the consumption of fruits, vegetables and livestock products. The low share of cereals in total calorie intake among higher income group does not signify nutritional deterioration. On the contrary, it reflects an improvement in the nutritional standards as the fall in calorie intake might be due to qualitative improvement in the diet.
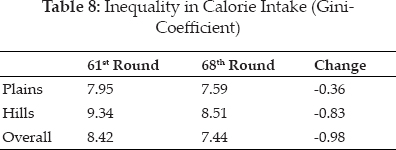
Inequality in calorie intake among different regions in both 61st and 68th rounds was measured by Gini coefficients (Table 8). The magnitude of the Gini coefficients showed a declining pattern in both plain and hill region. Inequality in plain region was lower in each round, when compared to that in hilly region. The Gini coefficient indicating the region-wide disparity in calorie intake declined by 0.36 per cent in plain region and 0.83 per cent in hilly region from 61st to 68th round.
Table 9 presents the food security profile of the state both in hill and plain regions in each NSSO round.
Households, whose calorie intake per consumer unit per day was less than the threshold value, i.e., 2700 kcal, were considered food insecure while households whose calorie intake per consumer unit per day equaled or was above these values were classified as food secure. The degree of food insecurity in the state was assessed using the three valued food security indices: incidence of food insecurity (F0), depth of food insecurity (F1), and severity of food insecurity (F2), following the Foster, Greer and Thorbecke poverty measure (1984).
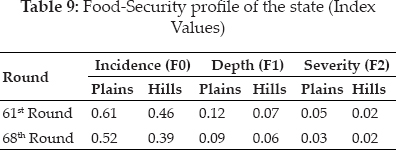
The head count index of food insecurity in 61st round showed that 61 per cent households in Plains and 46 per cent households in hills were food insecure, while the food insecurity depth which measures the extent by which food insecure households is below the food insecurity line was 0.12 for plains and 0.07 for hills. This implies that on the average, a food insecure household will require additional 324kcal/day in plains and 189 kcal/day in hills to exit food insecurity. SFIG = Squared Food Insecurity Gap, indicates the severity of food insecurity among the food insecure households which was 0.05 for plains and 0.02 for hills which implies 5 per cent households in plains and 2 per cent households in hills were most food insecure households in the state.
Conversely, households in 68th round fared well in terms of food security. Incidence of food insecurity came down to 52 per cent from 61 per cent in plains and 39 per cent from 45 per cent in plain region from 61st round. In 68th round depth of food insecurity reached to 0.09 in plains and 0.05 in plains which implies that additional 243kcal in plains and a 162 kcal were required in hills to exit food insecurity. Severity in plain region came down to 3 per cent from 5 per cent in 68th round while it was same for hill region.
CONCLUSION
The shape the dietary consumption pattern is determined by the interaction of many factors like income, prices, individual preferences and beliefs, cultural traditions as well as geographical, environmental, social and economic factors. The dietary changes that characterize the “nutrition transition” include both quantitative and qualitative changes in the diet. The results revealed that there was a considerable difference in dietary pattern when viewed in terms milk and milk products consumption, edible oils, fruits, vegetables and sugars across income groups. The intake of milk and milk products in total calorie consumption was more than double for HIG than LIG. Thus effect of improvement in the economic access to food consumption was identified as replacement of cereals by protective foods like milk, fruits and vegetables. At an overall level, LIG were still below threshold limit in 68th round in both the regions. The head count index of food insecurity showed that 52 per cent population in plains and 39 per cent population in hill region was food insecure till 68th round. A massive education and training drive to motivate farmers regarding nutrition and health is much needed to convince the farmers that their nutritional status can be improved even with on-farm and locally available resources and a targeted monitoring to ensure food availability through PDS to lower income population can be done and range of food products can be increased for this particular target group.
REFERENCES
Barah, B.C. 2010. Hill agriculture: problems and prospects for mountain agriculture. Ind. J. Agric. Econ., 65(3): p585-601.
Food and Agricultural Organization FAO. 2012. The state of food insecurity in the world economic growth is necessary but not sufficient to accelerate reduction of hunger and malnutrition.
Foster, J., Greer, J. and Thorbecke, E. 1984. A class of decomposable poverty measures. Econometrica, 52(3): 761–766.
Gopalan, C., Sastri R. and Balsubramanian. 1996. Nutritive value of Indian foods. National Institute of Nutrition, Indian Council of Medical Research, Hyderabad.
Hossain, N. and Green D. 2011. Living on a Spike: How Is the 2011 Food Crisis Affecting Poor People? Oxford: Oxfam.
Mamgain, R.P. and Reddy D.N. 2017. Outmigration from hill region of Uttarakhand: magnitude, challenges and policy options. Book chapter in Rural Labour Mobility in Times of Structural Transformation: Dynamics and Perspectives from Asian Economies, pp. 209–235.
National Institute of Public Finance and Policy (NIPFP) Report on Developmental Disability Index for Hill States in India; 2014.
Radhakrishna, R. and Kirit, S. 2002. Parikh India Development Report 2002, Oxford University Press.
Reserve Bank of India (RBI), Annual Report 2012 Available at: https://www.rbi.org.in.
United Nations, The Millennium Development Goals Report 2010. New York. United Nations.
World Health Organisation (WHO) Diet, Nutrition and the Prevention of Chronic Diseases, Technical Report Series 916, Geneva; 2003.