Economic Affairs, Vol. 65, No. 4, pp. 637-644, December 2020
DOI: 10.46852/0424-2513.4.2020.21
![]()
Case Study
Effect of Climate Variables on Yield of Major Crop in Samastipur District of Bihar: A Time Series Analysis
ABSTRACT
Climate change influences crop yield vis-à-vis crop production to a greater extent in Bihar. Climate change and its impacts are well recognizing today and it will affect both physical and biological system. Therefore, this study has been planned to assess the effect of climate variables on yield of major crops, adaptation measures undertaken in Samastipur district of Bihar. Secondary data on yield of maize and wheat crops were collected for the period from 1999–2019 to describe the effects of climate variable namely rainfall, maximum and minimum temperature on yield of maize and wheat. Analysis of time series data on climate variables indicated that annual rainfall was positively related to yields while maximum and minimum temperature had a negative but significant impact on maize and wheat yields. It actually revealed that other factors, such as; type of soil, soil fertility and method of farming may also be responsible for crop yield. Trend in cost as well as income of farmers indicated that income and cost of cultivation has no significant relationship with climate variable. On the basis of above observation it may be concluded that level of income of farmers changed due to change in the other factors rather than change in climatic variable over the period under study as cost of cultivation increases with increased in the price of input over the period but not due to change in climatic variable.
Highlights
 Effect of climatic variables like maximum temperature and minimum temperature has negative but signification effect on yield of major crops in Bihar.
Whereas level of income of farmers and cost of cultivation changed to change in other factors rather than climatic variables.
Keywords: Climate variable, rainfall, temperature, maize, wheat and Bihar
Agriculture is one of the most important sources of income of farmers in India. Almost more than 70% of the populations are directly or indirectly dependent on agriculture and its allied activities. The climate change causes many ill-effects on the farming. The magnitude of expected changes in temperature, rainfall and CO2 in future was simulated by various General Circulation Models by the IPCC (Watson et al. 1998). First of all, it increases the cost of inputs such as fertilizers, insecticides, plant growth regulators as the frequency of their usage increases in order to cope with the ill effects of climate change. So, keeping in the view the study has been planned to analyze the effect of climate factors on yield of major crops in Samastipur district of Bihar. This will help to increase understanding and knowledge to obtain optimum yield under prevailing climate conditions. Despite of the fact of having supportive soil, climatic variables affects on production of wheat and maize. It is well known that agriculture and climate are inter-dependent. So, it may be noted that slight change in climate variables can bring major impact, primarily on the crop yield and lately to the income of the farmers (Kumari et al. 2018).
How to cite this article: Ranjan, R.K. Kumari, M., Rahman, M., Panda, C.K., Homa, F. and Sashikala (2020). Effect of Climate Variables on Yield of Major Crop in Samastipur District of Bihar: A time Series Analysis. Economic Affairs, 65(4): 637–644.
Source of Support: None; Conflict of Interest: None ![]()
This change in weather up to long period of time, bring out the concept of climate change. Therefore, in order to decrease the impact of climate change, the intervention used by the farmers increases the initial cost i.e. expenditure over inputs increases. It has been estimated that farmers experienced changes in the cold season was (59.4%), followed by hot season (56.5%) however for the rainy season it was observed maximum changes i.e. about 80.5%. It was also reported by the farmers that the period of rainy season has now became shorter than that of what it used to be few years ago (Johnsen and Aune 2011).
It may be observed that these impacts influences on net income of farm, land revenue which has been estimated using cross-sectional data of climatic variables. Whereas while estimating the effects of changes in temperature or precipitation on cost and farm net revenues, it is possible to use climate scenarios to infer the impact of climate change on the productivity of identified crops along with their land revenue. (Joshi et al. 2009), identified three dimensions of vulnerability to climate change. The physical-environmental dimension\accounts for the harm caused by climate”. It means climatic conditions in a region and its impacts of climate change, effects on agricultural productivity or the distribution of disease vectors. The other dimension is socioeconomic dimension, it refers to “adaptive capacity or capacity against extreme events and adapt to change over the period and the third dimension, i.e. external assistance means, degree to which a region may be assisted in its attempts to adapt to change through its allied activities and business partners, in other regions, and international arrangements to provide aid”.
In Samastipur district around 60% of the rural people depend on agriculture for their livelihood, despite of the fact of availability of plenty of resources and suitable soil for growth of wheat and maize, the output obtained was very less. It was observed that in the year 2018–19 that the production of maize (Rabi maize) in Samastipur district was 1, 67,806 MT with productivity 5346 kg/ha. This comprises very less contribution to state production. The production of maize in Bihar in the year 2018–19 was 20, 98,443 MT with 7432 kg/ha however for wheat production, in the year 2018–19, was 64, 65,905 MT with 2998 kg/ha of productivity (krishi.bih.nic.in/Statistics/Maize-2018-19.pdf), whereas the share of district was again very low. The production of wheat in the year 2018–19 in Samastipur was 2, 00,725 MT with productivity of 3597 kg/hectare (krishi.bih.nic.in/statistics/wheat 2018–19.pdf). This may be due to one of the most crucial factor i.e., climate change. It is well known that agriculture and climate are interrelated. So, it can bring major impact primarily on the crop yield and ultimately to the income of the farmers. This change in weather up to long period of time, bring out the concept of climate change.
MATERIALS AND METHODS
The study was carried out in North Bihar state during the years 2018–19 and 2019–20. Secondary data pertaining to various climatic indicators like monthly rainfall, maximum temperature and minimum temperature were collected and compiled from different sources, viz., Directorate of Economics and statistics, Govt. of Bihar and Dr. RPCAU Department of Meteorology Pusa, Samastipur for the period from 1998–99 to 2018- 2019. Beside this, the agricultural data i.e. yield of maize and wheat, and MSP of maize and wheat were collected from Directorate of Economics and Statistics, India, for the mentioned period. To assessed the impacts of climate change on crop yield time series data of selected crops were quantified by using the lagged values based on the current values of each variable Only calculated changes (A) in model variables (dependent and explanatory variables) have been used in regression model to find out the impacts of, rainfall, minimum and maximum temperatures on yield of crops through use of production function mentioned below:
△ Yield = m + rr △ Climate + ε et al.
Here,
△ Yield is the observed trend in yield, m is the average yield change due to management and other non-climatic factors, △ Climate is the observed trend in temperature and rainfall, rγ is the yield response to this trend, and ε is the residual error. Detrending of the yields and climate variables using the residuals to calculate quantitative relationships between variation in climate and yield that can remove non-climatic influences such as adoption of new cultivars and change in crop management practices (Lobell & Field, 2007; Nicholls, 1997; Lobell et al. 2005). Detrending can be done by using the first- difference time-series for yields and climate variables i.e., the difference in values from one year to the next.
FINDINGS AND DISCUSSION
To assess the impacts of climate change on crop yield using time series data, there was a need to quantify first the lagged values based on the current values of each variable (see methodological part for more details). Only calculated changes (△) in model variables (dependent and explanatory variables) have been used in regression model to find out the impacts of, rainfall, minimum and maximum temperatures on yield of crops of interest. Furthermore, dummy variables such as floods and droughts were included to see if historical occurrence of these events has had impacts on crop yield.
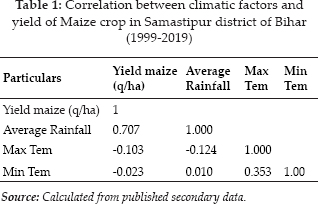
The findings of study revealed that annual rainfall has a positive and significant relation between, maize yield and shown contrary to the expected value that increase in rainfall can result in increase or decrease in crop yield. It implies that increase in rainfall has positive association shown an increased in yield of maze by 70 percent and vice versa. Whereas Maximum and minimum temperature had negative association between yield of maize and climatic factors in Samastipur district of Bihar as indicated in the table 5 that rise in maximum temperature leads to decrease in yield of maize by 10 percent and due to change in minimum temperature by two percent respectively. These results are related to the a priori expectations that an increase in temperature results in crop yield decrease. Regression analysis also indicated that the (R-Square values .050) 50 % variation in maize yield, are explained by the climatic variables and their respective extreme events. Whereas the t-value in the table indicated that temperature has negative and significant relationship (-.03) (-.15) respectively with the yield however with the rainfall it has positive relationship with yield (3.965). Climatic vulnerability was assumed to be positively related to the indicators such as variances in annual rainfall as well as minimum and maximum temperature variances, indicated that any increase or decrease of these climatic variables would increase the extent of losses of yield of selected crop in the districts to climate change. Glantz and Wigley (1986) studied the worldwide climate change and showed that any change in climatic variables like temperature and precipitation could induce vulnerability of food production in a major way.
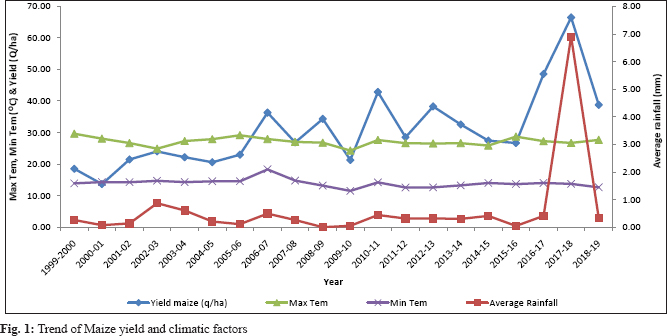
Trend in maize yield and climatic factors (minimum temperature maximum temperature and rainfall)
The same time series data were used to depict the trend in minimum temperature, maximum temperature, rainfall and maize yield since 1998 to 2019. It has been clearly indicated that yield of maize increased slightly in the period of. 2007, 2010 and in-between *2017 to 2018 there was dramatic changes and reached to the highest and then decreased thereafter in the mentioned period under study (Fig. 1). Same trend has been observed for the rainfall as over the period of study as it reached up to maximum in the year 2017–18. It may further revealed that the minimum rainfall was observed during the period 2000–01, 05, & 2008–09 and maximum was observed during 2017–2018 shown in the Fig. 1.
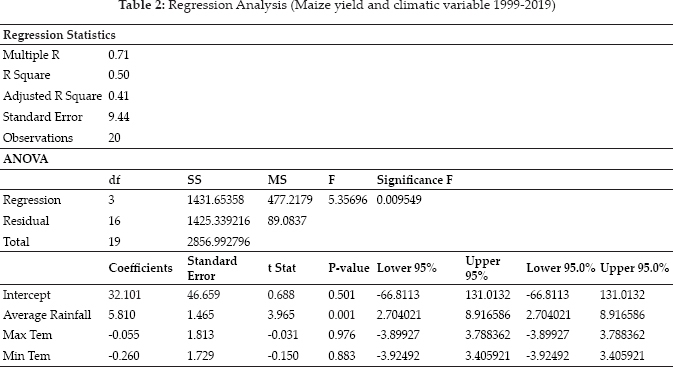
Regression analysis indicated that 76 percent of variation in maize yield was explained by the climatic variables and their respective extreme events. The t-value in the table 2 indicated that temperature has negative and significant relationship (-0.055) (-0.260) respectively with the yield however with the rainfall it has positive relationship with yield (5.810). P-value for the rainfall is less than t -value however for Max and Min temperature t-value was less than p-value implies that change in temperature had adverse affect on yield of wheat than the rainfall and has negative and significant relation between the yields over the period under study.
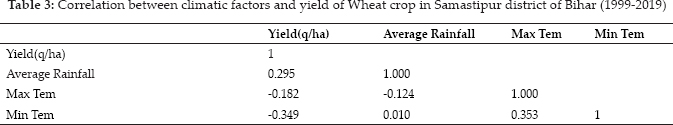
Same trend has been observed for the wheat crop as indicated in the table that annual rainfall has a positive and significant effect on, wheat yield shown contrary to the expected value that increase in rainfall could result in increase or decrease in crop yield. It implies that increase in rainfall caused an increased in yield of wheat by 29 percent and vice versa. Whereas maximum and minimum temperature was negatively correlatedd with yield of wheat in Samastipur district of Bihar as indicated in the table 5 that rise in maximum temperature leads to decrease in yield of wheat by 18 percent and due to change in minimum temperature by 34 percent respectively. It clearly indicated that change in minimum and maximum temperature has a negative and significant effect on wheat yield. For instance, a 1oC maximum temperature increase decreases yields of 18 percent and 34 percent respectively over the period under study. It may be concluded that change in minimum temperature adversely affected on yield of wheat in study area.
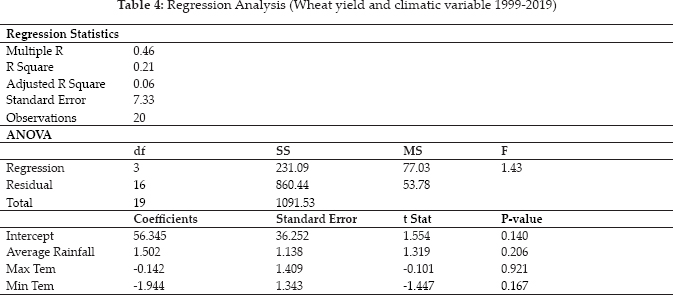
Regression analysis indicated that only 46 percent of variation in wheat yield was explained by the climatic variables and their respective extreme events. The t-value in the table 2 indicated that temperature has negative and significant relationship (-0.101) (.-1.447) respectively with the yield however with the rainfall it has positive relationship with yield (1.319). P-value for the rainfall is more than t -value however for Max and Min temperature t-value was less than p-value implies that change in temperature had adverse affect on yield of wheat than the rainfall and has negative and significant relation between the yields over the period under study. It may be concluded that, the negative correlation between maximum and minimum temperature on yield of both the selected crops could be due to the use of different varieties such as drought tolerant that require minimum rain fall, medium and short duration cultivars that could mature in short period. Erratic nature of the rain and lack of distribution of rainfall within the phonology of the crops growth could also be a factor because sometimes rains came at harvest period or even after harvest. Rainfall is not significant in explaining the effect of climate in maize crops production. The result is not compatible with that of Ayinde et al. were rainfall was significant in explaining the effect of climate in crop yield. However it was significant for wheat production. Yamoah et al. observed that effect of average temperature on yields has a negative effect on crop yields. Both maximum and minimum temperatures were negatively correlated with crops yield.
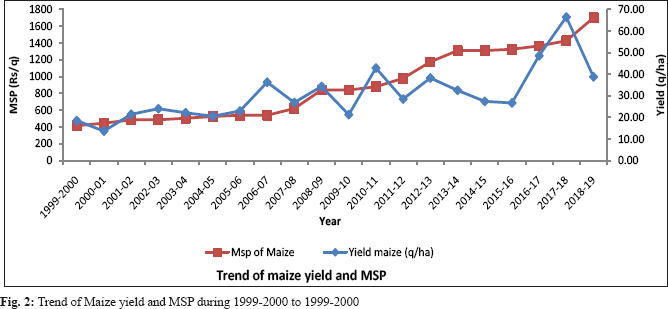
From Fig. 2 it has been observed that during the year 1999–2000 the minimum support price of maize was ₹ 400/ quintal and yield during the same was 20–22 quintal per hectare and reached up to maximum during the period 2017–18. However, prices as well cost during the same has been observed the same trend as it has been increases over the period under study. It may be concluded that climate variable has no relationship with cost of cultivation and minimum support price of maize but has significantly related with the yield of crop.
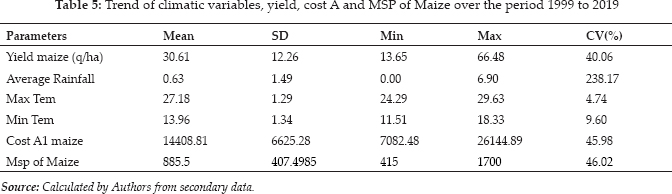
Statistical analysis of table 4 also indicated that mean value of yield varied from 13.65 quintal to 66 quintal per hectare i.e. recorded maximum yield during 2017 as it reached up to 66.48 quintal per hectare over the period under study. Whereas the cost of cultivation was ranged from ₹ 7082.48 to ₹ 26144.89 and MSP was from ₹ 415 to ₹ 1700. As far data pertaining to changed in Max and Min temperature was concerned it was recorded approximately changed in five degree and seven degree Celsius respectively over the period. However variation in rainfall was observed maximum as value of C.V was 238.17 percent. The co-efficient of variation of cost A and MSP was 45.98 and 46.02 percent respectively. However minimum variation had been observed for the maximum temperature (4.74 percent). It clearly indicated that income of farmers changed due to change in the other factors rather than change in climatic variable over the period under study as cost of cultivation increases with increased in the price of input over the period not due to change climatic variable.
Trend in wheat yield and climatic factors (19992019) in Samastipur District of Bihar
The same time series data were used to depict trend in minimum temperature, maximum temperature, rainfall and wheat yield since 1998 to 2019. Trend analysis indicated that yield.
Of wheat had significant relation with climatic variable as change in temperature during 2006–07 leads to increase in wheat yield by approximately 10 quintal per hectare i.e. from 20 quintal in 200102 to 30 quintal during 2006–07 and was reached maximum during the 2011–12 (35 -38 q/ha) where there was minimum changes in climatic factors had been observed thereafter reaching the maximum rainfall in peak during 2017 -18 the yield of wheat shown declined by 5 quintal. It means rainfall has also adverse affects on the yield of wheat crop. However change in minimum temperature has significant relation with yield as shown in increasing trend during the year of 2006–07 the yield was also shown an increasing trend over he period under study in Samastipur district of Bihar.
Trend of wheat yield, Cost A and MSP from 1999-2019)
It has been observed that during the year 1999–2000 the minimum support price of Wheat was ₹ 600/ quintal and yield during the same was 16 quintal per hectare and reached up to maximum during the period 2011–12. However, prices as well cost during the same has been observed the same trend as it has been increases over the period under study. It may be concluded that climate variable has no relationship with cost of cultivation and minimum support price of wheat crop but has significantly related with the yield of crop.
However, the associated variable cost /ha also indicated that it increased from ₹ 8000–35000/ ha over the period and peaked up during the 2019 whereas yield of wheat reached at peak during the year of 2011–12 where the estimated cost was approximately ₹ 12000/ha. It may be concluded that rise in cost A was due to change in the price of input not due the increased or decreased in yield of wheat.
CONCLUSIONS AND POLICY IMPLICATION
On the basis of above observation it may be concluded that only maximum and minimum temperature is statistically significant in explaining changes in yield of maize and wheat crop. This implies that increase in maximum and minimum temperature will result to decrease in crop yield. Rainfall has also positive effect on wheat yield. This could be as a result of the use of drought tolerant cultivars, early and extra-early cultivars which could reduce the impact on rainfall on crop production. The regression analysis further revealed that maize, and wheat have coefficient of determination of 0.50, and 0.26, respectively. This indicates that 50, and 26 % of the variation in yield of maize respectively and wheat can be, explained by the climatic parameters over the period in study area. It implies that 50, and 74 percent of the variation in maize, and wheat yield might be, explained by other factors not included in the study. It actually revealed that other factors, such as; type of soil, soil fertility and method of farming may also be responsible for crop yield rather than cost of cultivation and MSP of respective crops.
The livelihoods of farmers need to have a broad base and should not be restricted solely to the income out of farming activities. There is an urgent need for sensitization of the rural communities about the various schemes of the government for which the extension services need to have more interaction with rural masses. There should be a mechanism of direct subsidies to farmers, who are practicing environmental friendly practices. Compulsory insurance scheme should be provided to the farmers by cooperative societies at the time of seasonal loan which is not actually benefitting them. Under climate change scenarios, the total rainfall may not vary much but its distribution might be grossly affected. Therefore basic infrastructure needs to be improved for making agriculture sustainable i.e better road connectivity for better market access as well as village level water harvesting structures may be another important intervention at local level is need of hours.
REFERENCES
IPCC. 2007, Climate Change (2007): Impacts, Adaptation and Vulnerability. Contribution of Working Group II to the Fourth Assessment Report of the Intergovernmental Panel on Climate Change, (M.L. Parry, O.F. Canziani, J.P. Palutikof, P.J. Van der Linden, & C.E. Hanson, Eds.) Cambridge, UK, Cambridge University Press, http://www.ipcc.ch/publications_and_data/publications_ipcc_fourth_assessment_report_wg2_report_impacts_adaptation_and_vulnerability.htm [Retrieved
Isik, M. and Devadoss, S. 2006, An analysis of the impact of climate change on crop yields and yield variability, Applied Economics, 38(7): 835–844.
Joshi, N.P., Maharjan, K.L. and Piya, L. 2011. Effect of climate variables on yield of major food-crops in Nepal - A time-series analysis, Journal of Contemporary India Studies: Space and Society, 1: 19–26.
Johnsen, F.H. and Aune, J.B. 2011. Smallholder framer's perceptions of climate change and conservation agriculture: Evidence from Zambia. Journal of Sustainable Development, 4(4): 37–41.
Kumar, K.S. and Parikh, J. 1998b. Climate Change Impacts on Indian Agriculture: Results from a Crop Modeling Approach, In Dinar and others, eds. Measuring the Impacts of Climate Change on Indian agriculture, World Bank Technical Paper No. 402. Washington, DC: World Bank.
Kumar, K.S. Kavi and Parikh, J. 2001. “Indian agriculture and climate sensitivity; Global Environmental Change, 11: 147–154.
Mall, R.K. and Srivastava, A.K. 2002. ‘Prediction of potential and attainable yield of wheat: A case study on yield gap’, Mausam, 53(1): 45–52.
Mall, R.K., Lal, M., Bhatia, V.S., Rathore, L.S. and Singh, R. 2004. ‘Mitigating climate change impact on Soybean productivity in India: Asimulation study’, Agricultural and Forest Meteorology, 121(1-2): 113–125.
Owusu-Sekyere, J.D., Alhassan, M. and Nyarko, B.K. 2011. Assessment of Climate Shift and Crop Yields in the Cape Coast Area in the Central Region of Ghana. ARPN Journal of Agricultural and Biological Science, 6(2): 49–54.
Saini, A.D. and Nanda, R. 1986. Simulating growth and yield of maize in different agro-climatic regions, Indian Jr of Ag. Sciences, 56: 512–519.
Schlenker, W. and Roberts, M.J. 2008. Estimating the impact of climate change on crop yields: The importance of nonlinear temperature effects, Massachusetts, USA, NBER Working Paper 13799, National Bureau of Economic Research.