Economic Affairs, Vol. 65, No. 4, pp. 681-689, December 2020
DOI: 10.46852/0424-2513.4.2020.27
![]()
Case Study
Urbanization and its Impact on Production Diversity and Income of Farm Households: An Economic Analysis Across Rural-Urban Interface of Bengaluru
ABSTRACT
The study was conducted in North of Bengaluru with an aim to analyze effect of urbanization on production diversity, farm income and factors influencing the same across the rural-urban interface. The required data was collected randomly from 80 farmers each under rural, transition and urban gradients. Multiple linear regression was used to determine the drivers of farm income. Herfindahl index was employed to capture the extent of production diversification. Results revealed that the rural farmers diversified from food crops to vegetable and flower crops over the years. Whereas, farmers of transition and urban gradients chose to grow high value horticulture crops instead of food crops. During 2019, the extent of diversification was more in transition (0.21) and rural (0.25) gradients compared to urban (0.29) gradient. In rural gradients, the major share of farm income was from cereals (31.79 %) followed by vegetables (28.65 %) and perennials (17.88 %) in 2014 but the major share was replaced by vegetables (28.69 %) and flower crops (19.98) in 2019. In transition and urban gradients, the major source of farm income was from vegetables in 2014 which was later substituted by fruit crops in 2019. Over the period of five years, the percentage increase in average farm income of households was highest in urban gradient (143.07 %) followed by rural (140.15 %) and transition (110.50 %) gradients. Land holding size, education, borrowed capital and investment in farming emerged as the principal determinants of farm income. As a whole, the study concludes that, urbanization led investment on high value crops through crop diversification which played a significant role in augmenting the farm income.
Highlights
 Production diversity was ore in transition gradient followed by urban and rural gradient.
Urbanization and production diversity led to increase in farm income and the percentage increase in average farm income of households was highest in urban gradient than rural and transition gradients.
Keywords: Urbanization, production diversity, farm income and borrowed capital
‘Farmers are the backbone of Indian economy’ is always been the empathetic quote in India. Despite the fact that agriculture is the basis of livelihood for over two-thirds of the population, it just fills merely 15 per cent of the economic kit (Srivastava, 2020). This is an evidence for the horrific tale of quarter of the world's farmers and dent in India's so called back bone. To that end, this alarming fact calls for enhancing the incomes of the agrarian community. A glimpse of spatial crop distribution in India reveals the homogeneity within region and heterogeneity at the country level backed up by factors related to resources, technology, household, infrastructure, institutional and market which favors plough to plate.
How to cite this article: Udaykumar, M.S., Umesh, K.B., Srikantha Murthy, P.S. and Gaddi, G.M. (2020). Urbanization and its Impact on Production Diversity and Income of Farm Households: An Economic Analysis Across Rural-Urban Interface of Bengaluru. Economic Affairs, 65(4): 681–689.
Source of Support: None; Conflict of Interest: None ![]()
Further, Indian agriculture is dominated by small landholdings. They constitute 86.2 percent of all farmers, but own just 47.3 percent of the arable land, according to provisional numbers from the 10th agriculture census 2015–2016. In addition, the average size of landholding has shrunk to 1.16 ha in 2010–11 from 1.84 ha in 1980–81 (Census, 2011). Their meagre land is insufficient to earn adequate income for their livelihood. In other words, farming in India has become nonviable, specifically for rainfed and small farmers (Hamsa and Umesh, 2019). It was also reported that if agriculture is likely to be the sole source of income for small landholders, majority of them would have remained poor (Chand, et al., 2011). Therefore, numerous studies from developing countries have suggested that diversification of rural economy towards non-farm activities has considerable potential to augment farmers’ income and reduce rural poverty (Adams (2001), Barrett et al. (2001), De Janvry et al. (2005).
Crop diversification implies cultivating a wide variety of crops in order to overcome the production and financial risks. Transforming agriculture towards a more diversified cropping system is a viable pathway for improving diets, welfare, risk management and the resilience of rural households (Tesfaye and Tirivayi, 2019). It also aids in increasing the income of smallholders; lowering the risk of price fluctuation, climatic variability etc.; balancing food demand; increasing the production of quality fodder for livestock animals; beneficial for conserving natural resources; minimize environmental pollution; reduce dependence on off-farm inputs; and strengthens community food security (Rika and Zainalabidin, 2012). Because of urbanization, market demand increased for vegetables, flowers and fruits. To meet this increased demand, the farmers started to diversify the crops thus it will also lead to decrease the risk and increase the income. Persistent low farm income will have adverse effect on the future agriculture. In order to avoid the situation, smallholders must diversify their production by investing on their farms. Moreover, it was reported that farm investment was positively correlated with farm income (Ibekwe et al. 2010). Hence, to enhance farmers’ income and meet food security in the near future, there is a need for prioritizing crop diversification and private investment at farm level. Considering the importance of farm investment and crop diversification, an increase in the income of the farmers would uplift their saving potentialities, which will ultimately contribute to capital formation in agriculture (Hamsa and Umesh, 2019). In consequence, capital formation in agriculture leads to crop diversification and cultivation of high value crops.
In this backdrop, the present study was carried out with the following objectives:
METHODOLOGY
The study was carried out in rural-urban interface of north of Bangalore in Karnataka. North transect was further divided into three layers namely rural, transition (peri-urban) and urban gradients. The distinction of the transect into rural, transition (peri-urban) and urban gradient was made based on the survey stratification index (Ellen et al. 2017) developed by considering percentage of built-up gradient and its linear distance from the city centre. The random sampling method was adopted for the selection of villages as well as farmer households. The sample frame comprised of 240 farmers representing 80 each from each gradient.
In order to address the objectives of the study, data was obtained from the selected farmers using a pre-tested well-structured schedule through personal interview. The information elicited from the respondent farmers pertained to cropping pattern, land holdings, asset position, family size, educational level, investment in farming and decision making. Further, data pertaining to cropping pattern and income in two intervals i.e., during 2014 and 2019 was collected from the sample respondents based on memory recall to know the crop diversity across rural-urban interface of north of Bengaluru.
ANALYTICAL TOOLS
Farm income
Gross income generated from the crops grown during 2014 and 2019 was collected on recall basis hence suffers from memory recall bias. Nevertheless, efforts were taken to reduce the bias during data collection. However, the information on income pertaining to 2019 do not suffer much from the memory recall bias. Further, an attempt was made to bring actual gross income by the farmers during 2014 to current prices of 2019 using inflation rate to account for inflationary effects. The difference in the rate of inflation was too low between 2014 (4.90%) and 2019 (4.54%) implying that, the change in the value of money between these two periods was small. Hence, the actual gross incomes corresponding to 2014 and 2019 are compared.
Herfindahl Index (HI)
It is the sum of the squared proportions of acreage under each crop in relation to the gross cropped gradient, as given in equation (1)

Where, Pi represents the acreage proportion of the ith crop in the total gross cropped gradient.
The Herfindahl Index takes the value of one when there is specialization and approaches zero when there is diversification. HI was calculated at the gradient level for all the three regions.
Multiple linear regression analysis
To examine the factors influencing the income of farm households, the farm household income per annum was regressed in relation to age, education, family size, land holding size and livestock size. The regression equation was framed as:
Where,
X1= Age (years of experience); X2= Total land holding (acres); X3= Education attainment (years of schooling); X4= Family Size (No.); X5= Farm investment (₹); X6= Borrowed capital (₹); D1: Dummy variable as ‘1 0’ for transition farm households; D2: Dummy variable as ‘0 1’ for urban farm households and dummy ‘0 0’ for rural farm households; ui: Error term; β1, β2, …… β6 are the regression co-efficient for the variables X1, X2, …… X6, respectively. β7 and β8 are the regression coefficients for dummy variables D1 and D2, respectively.
RESULTS AND DISCUSSION
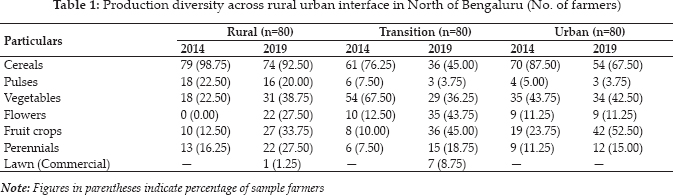
Production diversity across rural urban interface in north of Bengaluru
Production diversity across rural, transition and urban interfaces of North of Bengaluru between the time period 2014 and 2019 is presented in Table 1. The crop diversification was mainly cereal based across rural urban interfaces between 2014 and 2019. In case of rural gradient, cereals were predominantly grown, out of the 80 respondents, 79 (98.75 %) in 2014 and 74 respondents (92.5 %) in 2019 were growing cereals since cereals were the major staple food crop. The number of farmers growing vegetables has increased from 22.5 per cent in 2014 to 38.75 per cent in 2019. There were no farmers who grew flower crops in the year 2014, but during 2019, there were 22 (27.5 %) farmers who had started growing flowers. Because of urbanization in and around the study gradient the demand for flowers increased drastically, hence the farmers started cultivating flower crops. Further, the number of farmers growing fruit crops was ten during the year 2014 while 17 more farmers were added to the list in 2019. Similarly, farmers growing perennials had increased from 16.25 per cent to 27.5 per cent. Thus, farmers in rural gradient had allocated their land for different crops after maintaining the gradient for cereals and pulses cultivation.
In the transition gradient, there was a steady fall in the number of farmers growing cereals and vegetables. Majority of these farmers switched to growing flower, fruit crops and perennials from cereals, pulses and vegetables. It was interesting to note that about 8.75 per cent of farmers in transition gradient had taken up commercial lawn cultivation since there exists a huge demand for the lawn and also it fetches higher returns.
Crop diversity of the urban farmers didn't change much between 2014 and 2019. Though there was a decrease in number of farmers growing cereals, they still managed to grow other crops like vegetables, flowers and perennials. During 2014, 23.75 per cent of farmers were growing fruit crops and the percentage increased to 52.5 per cent during 2019. The five years’ period had witnessed farmers switching to cash crops such as vegetables, flowers, fruit crops and perennials from their regular cereals and pulses cultivation. Rural farmers diversified from food crops to vegetable and flower crops. Whereas, farmers of transition and urban gradients chose to grow high value horticulture crops instead of food crops. As these horticultural crops have higher productivity per rupee of investment and were less volume high value crops. Increased awareness on cultivation of high value crops, increased access to the market information, identifying the new supply and demand chains have proved the worth of shifting from food crops to high value crops. Because of these reasons the farmers invested on high value crops in recent years. This has led to improvement in the farmer's welfare. The results of the study by Sanjeev and Sakshi (2015) supports the findings of this study.
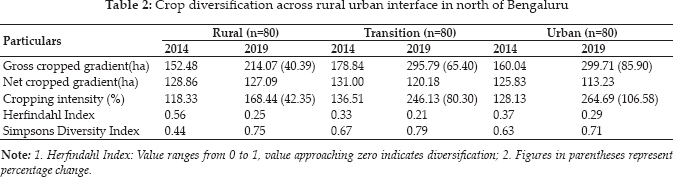
Crop diversification by farm households
The diversification of crops by farmers across rural urban interface is presented in Table 2. The per cent change in gross cropped gradient was to the extent of 40.39 per cent, 65.40 per cent, and 85.90 per cent in rural, transition and urban gradients, respectively from 2014 to 2019. The increase in cropping intensity was to the extent of 42.35 per cent, 80.30 per cent, and 106.58 per cent in rural, transition and urban gradients, respectively during the reference period. The Herfindahl index values in the year 2019 were approaching zero compared to the values in the year 2014 which indicates higher crop diversification during 2019.
During 2019, the extent of diversification was more in transition (0.21) compared to rural (0.25) and urban (0.29) gradients. The cropping intensity between 2014 and 2019 clearly shows that farmers cultivated their land more than once in a year. By investing on water and irrigation structures, the land is put under cultivation almost round the year. The farmers growing fruit and perennial crops had increased from 2014 in transition and urban gradients. Also, vegetables were cultivated by more number of farmers across the rural urban interface. It is evident from the results that agriculture has been transforming from traditional subsistence to high-value agriculture (Sanjeev and Sakshi, 2015).
Diversification was more in transition gradient, farmers of transition gradient had good access to farm information and technology and were more confident in reaching the consumers with their produce. Transition and urban farmers choose direct marketing activity to market their produce which fetched them high income and this was also the major reason for more diversification towards commercial crops. Crop diversification is important to farmers to mitigate the risk on one hand and to meet different needs and demands of the consumers on the other hand. Having diversification is always beneficial in farming business. More the diversification more will be the profit and less chances of incurring losses due to crop failures.
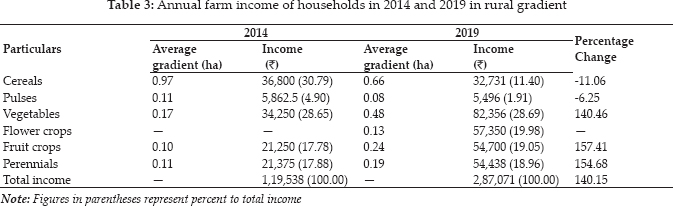
Average annual income of farm households during 2014 and 2019 in rural gradient
The average annual farm income of households during 2014 and 2019 in rural gradient (Table 3) indicated that, during 2019 the average farm income of households increased by 140.15 per cent as compared to 2014. During 2014, the major share of farm income was from cereals (30.79 %) followed by vegetables (28.65 %) and perennials (17.88 %). Whereas, during 2019 the major share of income came from vegetables (28.69 %) followed by flower crops (19.98 %), fruit crops (19.05 %) and perennials (18.96 %). The contribution of vegetables and flower crops towards the total farm income was substantial in the year 2019 since more number of farmers invested on flower crops due to better market accessibility.
The percentage change in income was highest in case of fruit crops (157.41 %) and perennials (154.68 %) because the rural farmers invested on fruit crops like grapes, sapota and plantation crops like arecanut and coconut which fetched higher returns compared to other crops. Both the average gradient and average farm income had increased in case of vegetables between 2014 and 2019. Its contribution towards percentage change in income was 140.46 per cent which indicates the scope for cultivation of vegetables in the future years. Despite the fact that transformation from traditional crops to commercial crops has occurred, the farmers in the rural gradients are still growing cereals and pulses for their household consumption and this has been clearly reflected in the Table 3.
Annual farm income of households during 2014 and 2019 in transition gradient
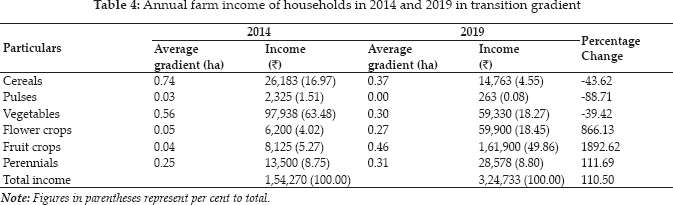
The results revealed that average annual farm income of households in transition gradient during 2014 was T 1,54,270 and it has increased to T 3,24,733 during 2019 (Table 4). During 2014, the major source of income was from vegetables (T 97,938), followed by cereals crops (T 26,183), perennials (T 13,500) and fruit crops (T 8,125). Whereas, during 2019 major source of income was from fruit crops (T 1,61,900), flowers (T 59,900) and vegetables (T 59,330).
The percentage change in income was observed highest in fruit crops (1892.62 %) followed by flower crops (866.13 %) and perennials (111.69%) because majority of farmers shifted from food crops to flowers and high value fruit crops. As a result of urbanization, flowers and high-value horticulture crops with assured market have more potential in increasing farm income. Flower crops occupied a lion's share in air freight carriages from Bengaluru whose demand comes from Middle East to European countries as it is customary
in those countries to have a flower as a part of any celebration which supports the exhibition of increase in the income. These results are similar to the results of the study conducted by Birthal et al. (2007). In case of pulses, cereals and vegetables, there was decrease in the income to the tune of 43.62 per cent 88.71 per cent and 39.42 per cent, respectively because of low profitability from the cereals and pulses. Generally, the prices of cereals and pulses are quite rigid at very low level, this demoralize the farmer to cultivate them. So, change in income from cereals and pulses was negative.
Annual farm income of households in 2014 and 2019 in urban gradient
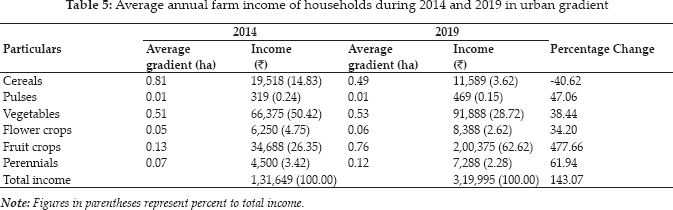
Urban farm households’ average annual farm income (Table 5) increased by 143.07 per during 2019. During 2014, out of the total income, the major contribution was from vegetables (50.42%) followed by fruit crops (26.35 %) and cereals (14.83%). Whereas, income from fruit crops (₹ 2,00,375) followed by vegetables (₹ 91,888) formed the major source of income during 2019.
The average gradient under fruit crops in 2019 had increased by more than five times than the average gradient in 2014. The average gradient of cereals crops has decreased in 2019, whereas in case of vegetables and perennials marginal increase in the gradient was noticed during 2019. The percentage change in income was highest in case of fruit crops and it amounted to 477.66 per cent. The income from fruits and vegetables has spiraled due to the fact that increase in the investments in the market oriented commercial cultivation backed up by assured market of multimillion non-agricultural population of Bengaluru City whose recipes and eating habits’ main ingredients are these fruits and vegetables. The shrink in the income from cereals to nearly 40 per cent is true reflector of the inelastic demand which prevails in the market hindering the producer to take up cultivation of cereals.
Results (Table 3, 4 and 5) showed that over a period of five years the percentage increase in the average farm income of households was more in urban gradient (143.07 %) followed by rural (140.15 %) and transition (110.50 %) gradients. This is because, urban farmers are investing more in high value horticulture crops which fetched good returns.
Majority of transition and urban farmers are moving out of agriculture and they were interested in taking up non-farm activities along with the agriculture. The average gradient of farmers under cereal crops has decreased across all the three transacts because of lower income from cereals compared to other crops. Income of the farmers in rural, transition, and urban gradient was directly proportional to the gradient under crops. In all the three gradients, income of the farmers increased since investment on water and irrigation structures to cultivate vegetables, flowers and high value horticulture crops has increased with a greater potential to increase farmer's income and standard of living.
Factors affecting farm income
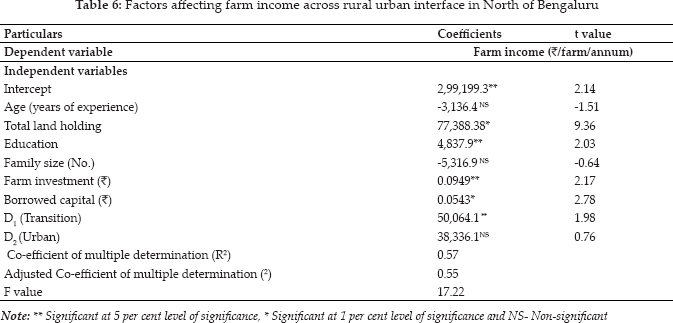
Multiple linear regression model was used to analyze the factors influencing the farm income of households and the results are depicted in Table 6. The ‘F’ value of the regression was 17.22 and was significant at one per cent indicating good fit of the model. The co-efficient of multiple determination (R2) was 0.55 indicating that the variables included in the regression model explained about 55 per cent of the variation in farm income. The threshold farm income was ₹ 2,99,199.3 per farm which is the contribution of other factors which are not included in the regression analysis.
Annual farm income was considered as dependent variable whereas factors such as age, education, family size, total land holding, borrowed capital and net investment were taken as independent variables. The regression results revealed that, factors like education, total land holding, borrowed capital and investment were significantly influencing the annual farm income of households. Increase in total land size by one acre would increase annual farm income by ₹ 77388.38. The results are in line with the study conducted by Parvin and Akteruzzaman (2012) wherein the authors reported that farm size significantly and positive affected the farm income. Singh (2016) and Gururaj et al. (2017) also reported that income from cultivation increased with increasing land holding size. With increase in education by one-year, annual farm income would go up by ₹ 4,837.9 as education would improve the knowledge. Investment in farming and borrowed capital also significantly influenced the farm income. For every one-rupee increase in the borrowed capital, the farm income increases by ₹ 0.054. Every one-unit increase in the investment in farming, the farm income increases by 0.09 units. Radha (2019) in her study reported that family size, size of farm, livestock size and net investment were the major factors influencing the farm income of the households.
To find the extent of farm income across urban, transition and rural farm households, two dummy variables were used viz., D1 for transition farmers, D2 for urban farmers. The intercept indicates the threshold farm income, which was T 2,99,199.3 per farm. Due to urbanization, the threshold farm income per farm is shifted by T 50,064.1 as given by the coefficient of the dummy variable (D1 was significant at five per cent) used for farmers in the transition gradients. Hence, the threshold farm income per farm in transition gradient was = T 2,99,199.3 + T 50,064.1 = T 349263.4 per farm. In uran gradients, threshold farm income per farm is shifted by T 38,336.1 per farm indicating that the threshold farm income per farm in urban gradient was T 3,37,535.4. The results precisely indicated that, threshold farm income was more in transition farmers followed by urban and rural farmers.
CONCLUSION
To realize the goal of doubling farmers’ income by 2022–23, the sources of growth in income must be identified and prioritized. Irrigation management, investment in high value horticulture crops and crop diversification can bring a substantial growth in farm output. Diversification towards high-value crops can bring significant gains to farmers’ income. Herfindahl index and raise in income provided evidence regarding the impact of production diversity on farm income which in turn aids in strengthening farmer's welfare. Crop diversification benefits the farmer mainly in the sense that cultivating several crop species assists to cope with both price and production risks and ensures added food and income options for the household through market participation from the surpluses. Having diversification is always beneficial in farming business. More the diversification more will be the profit and less will be the chances of incurring loss due to crop failures. Hence, there is a need to raise awareness on crop diversification and scientific cultivation of high value crops. Multiple regression analysis clearly indicated that farm credit and investment in farming are strongly associated with farm income. Hence, farmers must lay emphasis on availing financial support from institutions for investment. Further, the study revealed that farm income was more in transition and urban gradients than rural gradient. Therefore, efforts are needed to enhance investment in rural gradients to augment farm household income and retain the youth in agriculture so that rural economies can become viable.
ACKNOWLEDGEMENTS
The authors wish to thank, farmers for sparing their valuable time in providing precious information. This work was carried out in collaboration between authors. Author conducted a study during his Masters work (2017) and he designed the study, performed the statistical analysis, wrote the protocol and wrote the complete manuscript. Author Dr. K.B. Umesh is the major advisor/guide for my masters degree, and he corrected the manuscript, guided me regarding how to conduct the study and select the tools for analysis, etc. and Author Dr. P.S. Srikantha Murthy and D.G.M. Gaddi are members of Advisory committee, and corrected the manuscript, guided me regarding how to conduct the study and select the tools for analysis, etc.
REFERENCES
Adams, R.H. 2001. Non-farm Income, Inequality and Poverty in Rural Egypt and Jordan. Policy Research Working Paper 2572. World Bank, Washington, D. C.
Barrett, C.B., Reardon, T. and Webb, P. 2001. Non-farm income diversification and household livelihood strategies in rural Africa: Concepts, dynamics and policy implications. Food Policy, 26(4): 315–332.
Chand, R., Pal, P. and Singh, A. 2011. Farm size and productivity: Understanding the strengths of smallholders and their livelihoods. Economic and Political Weekly, 54(26/27): 5–11.
De Janvry, A., Sadoulet, E. and Zhu, N. 2005. The Role of Non-farm Incomes in Reducing Rural Poverty and Inequality in China. Working Paper 1001. Department of Agricultural & Resource Economics, University of California, Berkley.
Ellen, M.H., Monish, J., Nils, N. and Thomas, M. 2017 Construction and use of a simple index of urbanization in the rural-urban interface of Bangalore, India. Sustainability, pp. 1–21.
Gururaj, B., Hamsa, K.R., Ramesh and Mahadevaiah, G.S. 2017. Doubling of small and marginal farmer's income through rural non-farm and farm sector in Karnataka. Economic Affairs, 62(4): 581–587.
Hamsa, K.R. 2019. Capital formation in agriculture - Impact on farm productivity, income and propensity to save in Southern Karnataka. PhD Thesis (Unpub.), Univ. Agric. Sci., Bangalore.
Hamsa, K.R. and Umesh, K.B. 2019. Micro analysis of household propensity to save: Empirical evidence from southern Karnataka. Multilogic in Science, 9(31): 31–35.
Ibekwe, U.C., Eze, C.C., Onyemauwa, C.S., Henri-Ukoha, A., Korie, O.C. and Nwaiwu, I.U. 2010. Determinants of Farm and off -farm income among farm households in South East Nigeira. Academia Arena, 2(10): 58–61.
Kumar, S. and Gupta, S. 2015. Crop diversification towards high-value crops in India: A State Level Empirical Analysis. Agric. Econ. Res. Rev., 28(2): 339–350.
Parvin, M.T. and Akteruzzaman, M. 2012. Factors affecting farm and nonfarm income of Haor inhabitants of Bangladesh. Progress. Agric., 23(1 & 2): 143-150.
Radha, S. 2018. Economic viability of farm households In central and southern dry zones of Karnataka. M.Sc. (Agri.) Thesis (Unpub.), Univ. of Agric. Sci., Bengaluru.
Singh, B.P., Joshi, P. K., Roy, D. and Thorat, T. 2007. Diversification in Indian agriculture towards high-value crops. IFPRI discussion paper, pp. 1–29.
Singh, S. 2016. Income and employment of marginal and small farmers in south- western Punjab. M.Sc. Thesis (Unpub.), Punjab Agric. Univ., Ludhiana.
Srivastava, R.C. 2020. Agriculture pivotal to economic revival. Kurukshetra, 68(10): 11–15.
Terano, R. and Mohamed, Z. 2012. Expenditure analysis of the farm household economy in Malay Paddy Growing villages. Australian J. of Basic and Appl. Sci., 6(12): 351–358.
Tesfaye, W. and Tirivayi, N. 2019. Crop diversity, household welfare and consumption smoothing under risk: Evidence from rural Uganda. World Development, 125: 1–18.