Molecular characterization of bacterial leaf blight resistant
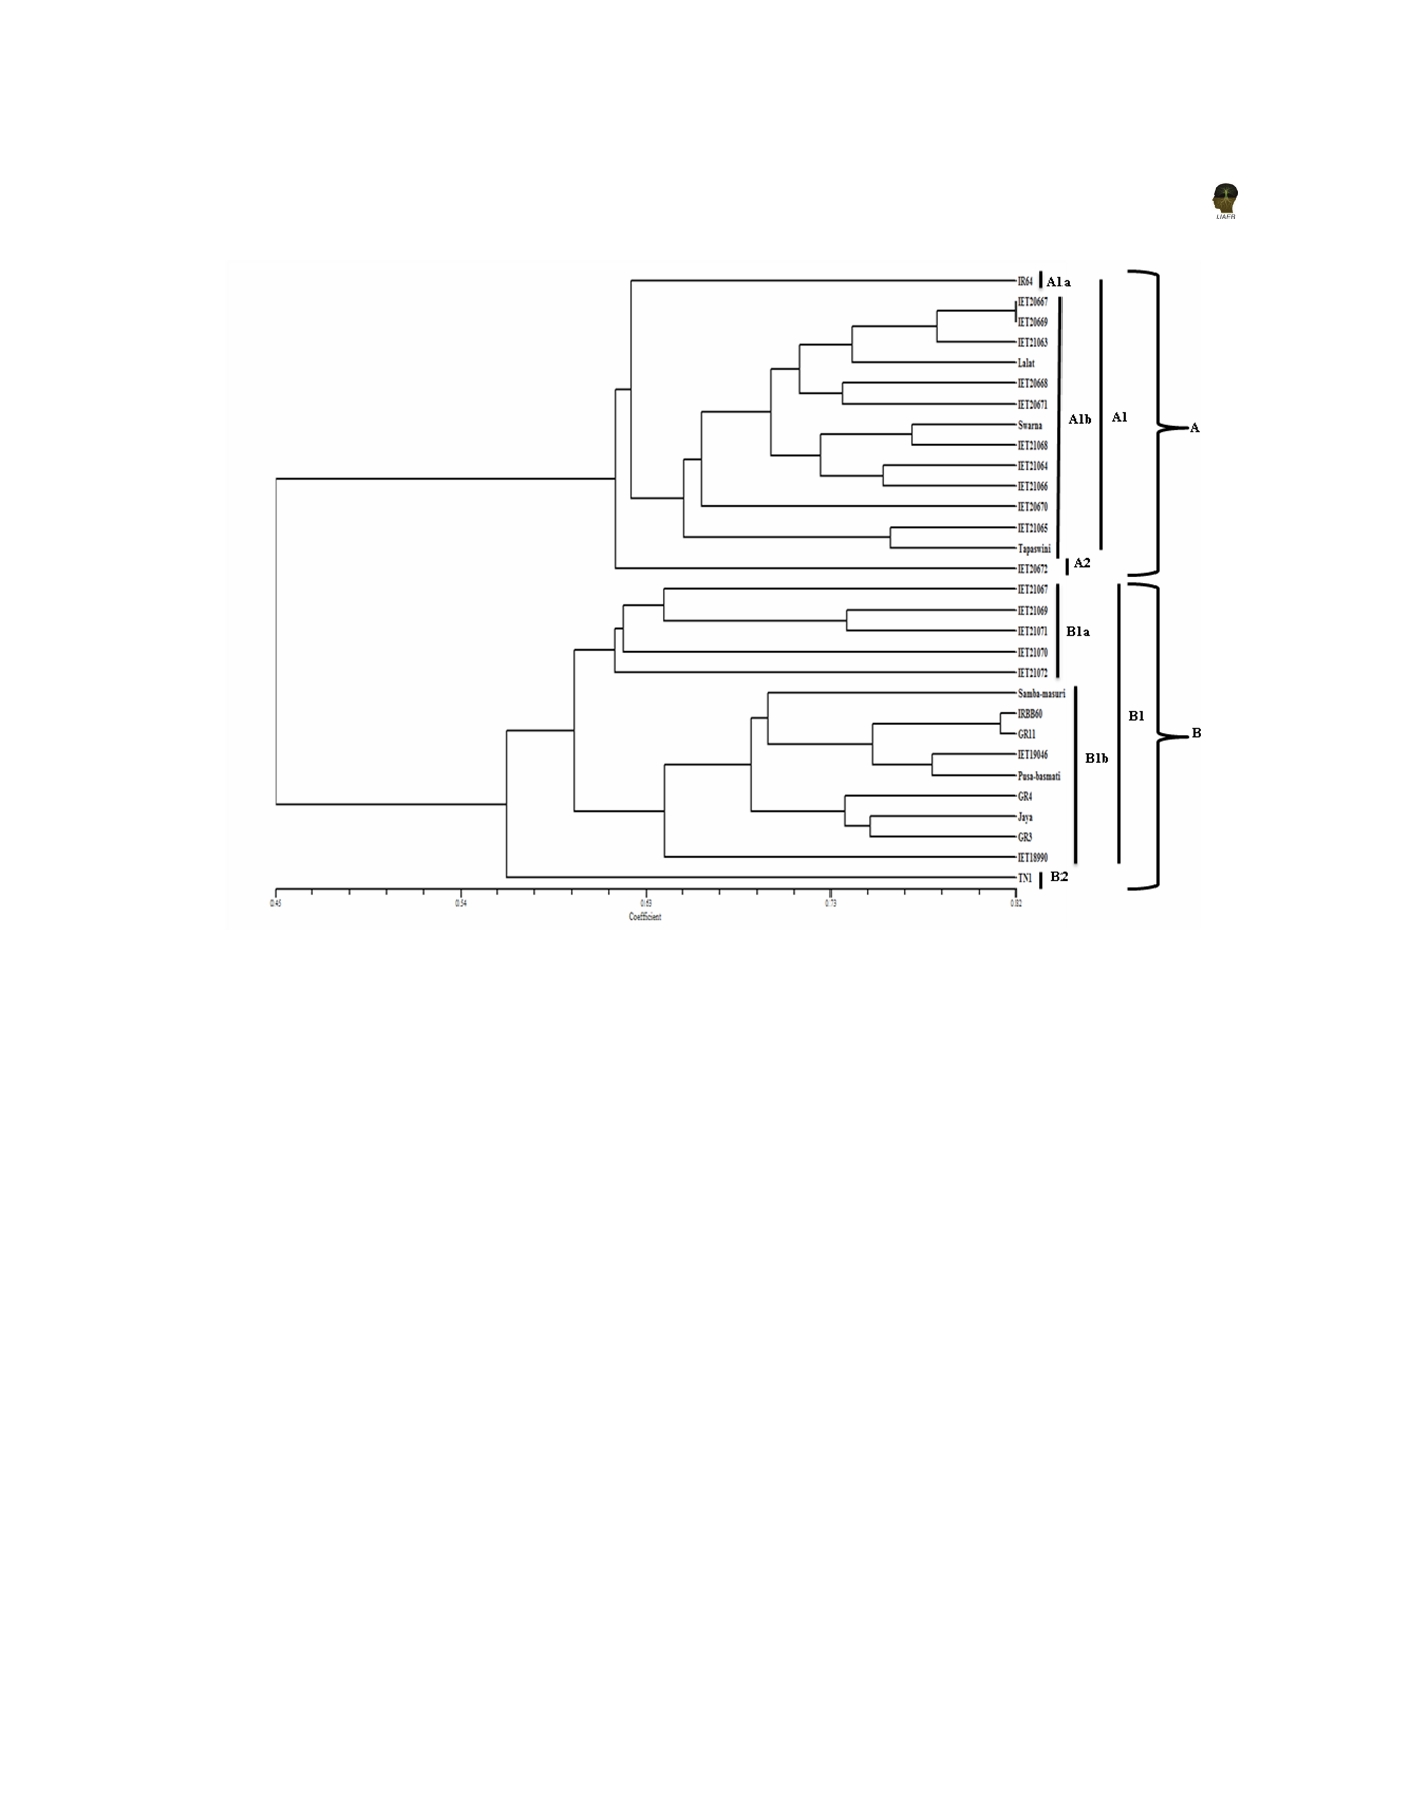
Figure 3: Dendrogram showing clustering of 30 rice genotypes constructed using UPGMA based on Jacquard’s similarity
coefficient obtained from RAPD analysis.
273 loci were found polymorphic, showing 86.68%
(NIL of Lalat) recorded maximum similarity (0.75) with
polymorphism. The PIC values ranged from 0.72 (OPC
its recurrent parent Lalat. All the NILs of Tapaswini
11) to 0.94 (OPP-06) (Table-2) with an average of 0.86.
showed low values of similarity coefficient (≤ 5.0). IET
The RAPD primers produced fragments of different sizes.
19046 (NIL of Samba Masuri) and IET 18990 (NIL of
The minimum sized fragment (95 bp) was amplified by
Pusa Basmati-1) registered 0.71 and 0.63 similarity
primer OPP 01, whereas maximum sized fragment (5713
coefficient, respectively, with their respective recurrent
bp) was amplified by primer OPP 06. The highest (100%)
parents. IET 21067 (NIL of Tapaswini) showed least
polymorphism were exhibited by primers, OPA 05, OPA
similarity values with all other NILs. Similarly, IRBB
09, OPA 12 (Rao et al., 2003), OPAB 09, OPAE 03,
60 also exhibited lower values. A dendrogram (Figure-1)
OPB 17, OPH 04, OPP 03, OPP 17 and ES 19, while the
based on UPGMA analysis, produced by pooled RAPD
lowest polymorphism (40%) was observed with primer
data showed two major clusters A and B. Cluster A
ES 22. The Jaccard’s similarity coefficient values ranged
included recurrent parents IR 64, Swarna, Lalat and their
from 0.35 (between IET 20667 and IET 21067) to 0.82
respective NILs and Tapaswini and its near isogenic
(between IET 20667 and IET 20669) (Table-3). Out of
line (IET 20672). Cluster B comprised recurrent parents
three NILs of IR 64, IET 20667 showed maximum genetic
Samba Masuri, Pusa Basmati-1 and their respective
similarity (0.74) with the recurrent parent IR 64; while
NILs, NILs of Tapaswini and susceptible check cultivars.
for Swarna, all three lines exhibited moderate degree of
Cluster A was divided into two sub clusters A1 and A2.
genetic similarity ranging from 0.63 to 0.67. IET 21063
Sub-cluster A1 was further divided into A1a and A1b.
435